Report 3 Group 1
Tài liệu học tập môn Chemistry Laboratory (CH012IU) tại Trường Đại học Quốc tế, Đại học Quốc gia Thành phố Hồ Chí Minh. Tài liệu gồm 7 trang giúp bạn ôn tập hiệu quả và đạt điểm cao! Mời bạn đọc đón xem!
Môn: Chemistry Laboratory (CH012IU) 59 tài liệu
Trường: Trường Đại học Quốc tế, Đại học Quốc gia Thành phố Hồ Chí Minh 2 K tài liệu
Tác giả:

Preview text:
lOMoARcPSD|364 906 32 LAB REPORT 3 LRC CIRCUITS
Date of Experiment: 10/04/2023
Date of Report: 16/04/2023 Members: 1. Cao Hoàng Khôi Nguyên
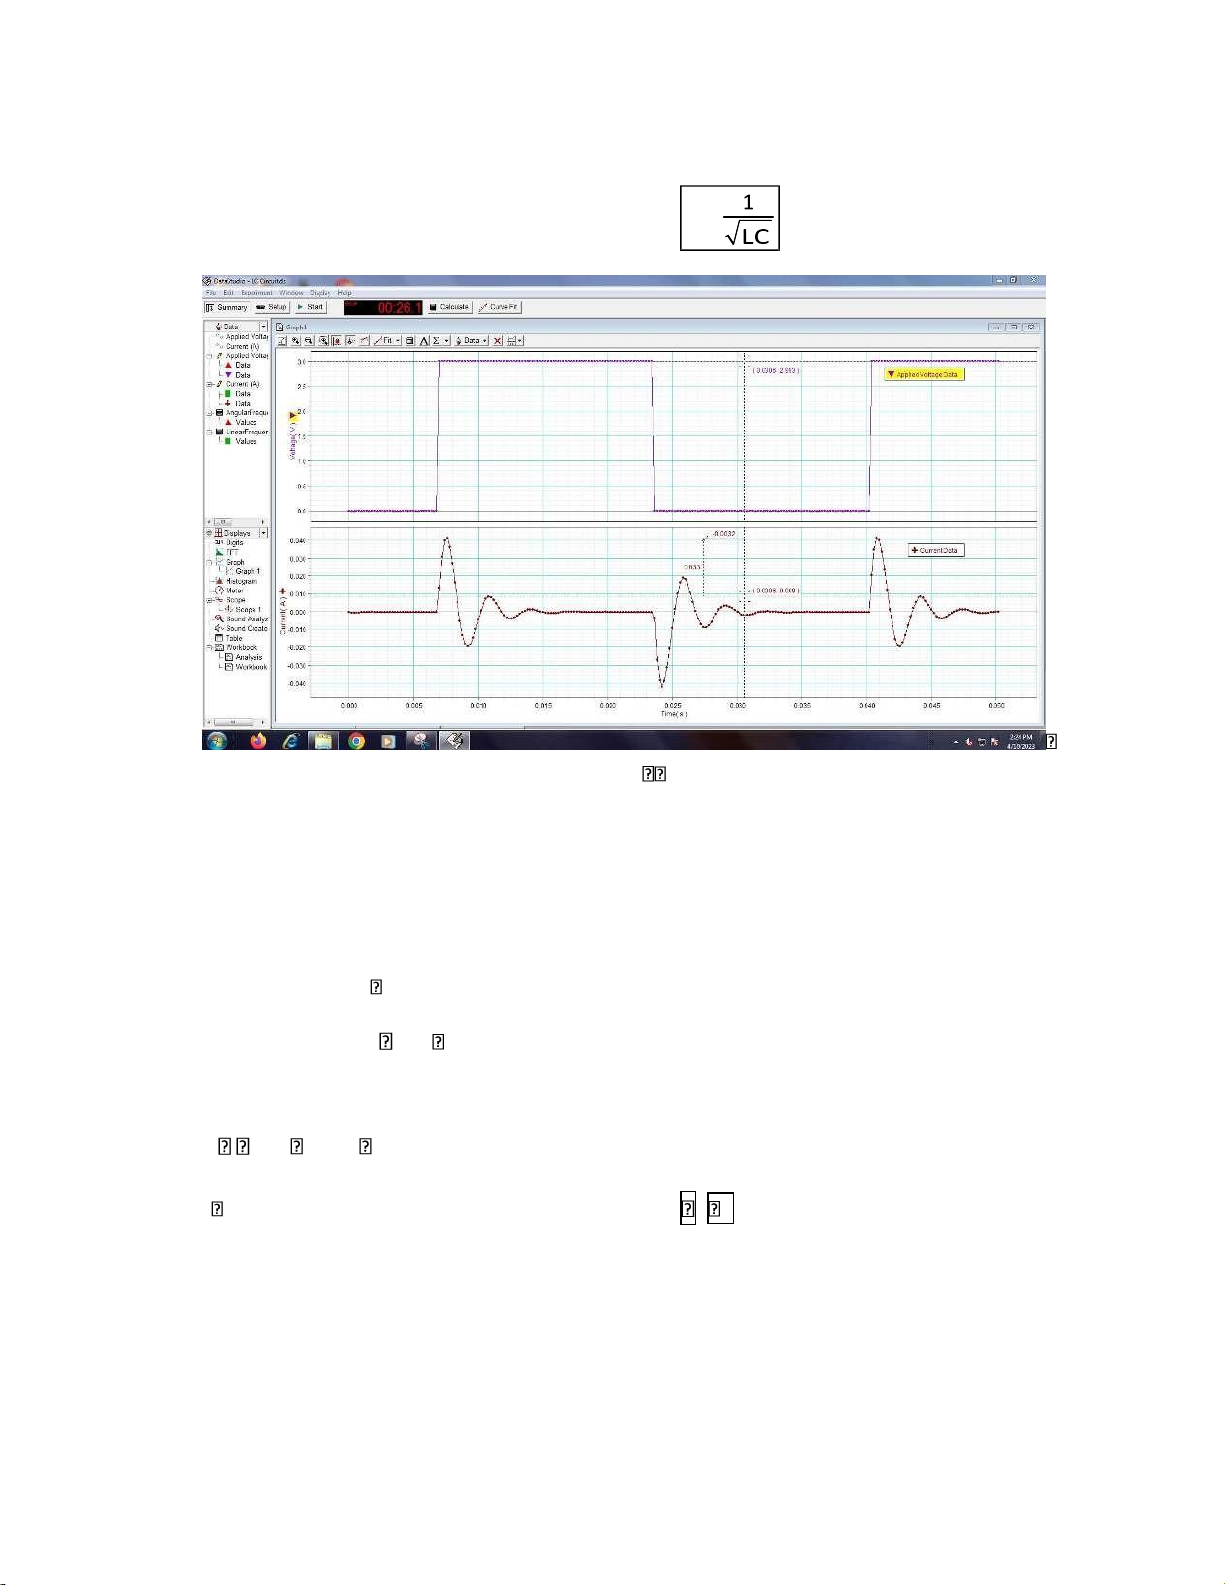
2. Nguyễn Châu Hoàng Quyên 3. Trần Trọng Nhân lOMoARcPSD|364 906 32 1. LC Oscillations Theoretical values: Inductance: L = 0.028H Capacitance: C = 10uF
Angular frequency (theory): theo = 1889.82 rad/s Experimental data:
Time at max/min current: t I_max = 0.0076s
Time at next max/min current: t V_max = 0.0108s Time difference: t = 0.0032s Period: T = 0.0032s
Linear frequency: f = 312.5 Hz
Angular frequency (experiment): exp = 1963.49 rad/s
Compare the angular frequencies between theory and experiment: the angular frequency
of the experiment larger than the theory (1963.49Hz < 1889.82Hz).
exp theo 100% 1963.49 1889.82 100% 3.9% Error theo 1889.82
- The error is caused due to the non-ideal inductor, which includes resistance inside,
making the circuit into an RLC circuit.
- The error <10%, which is acceptable lOMoARcPSD|364 906 32 2.
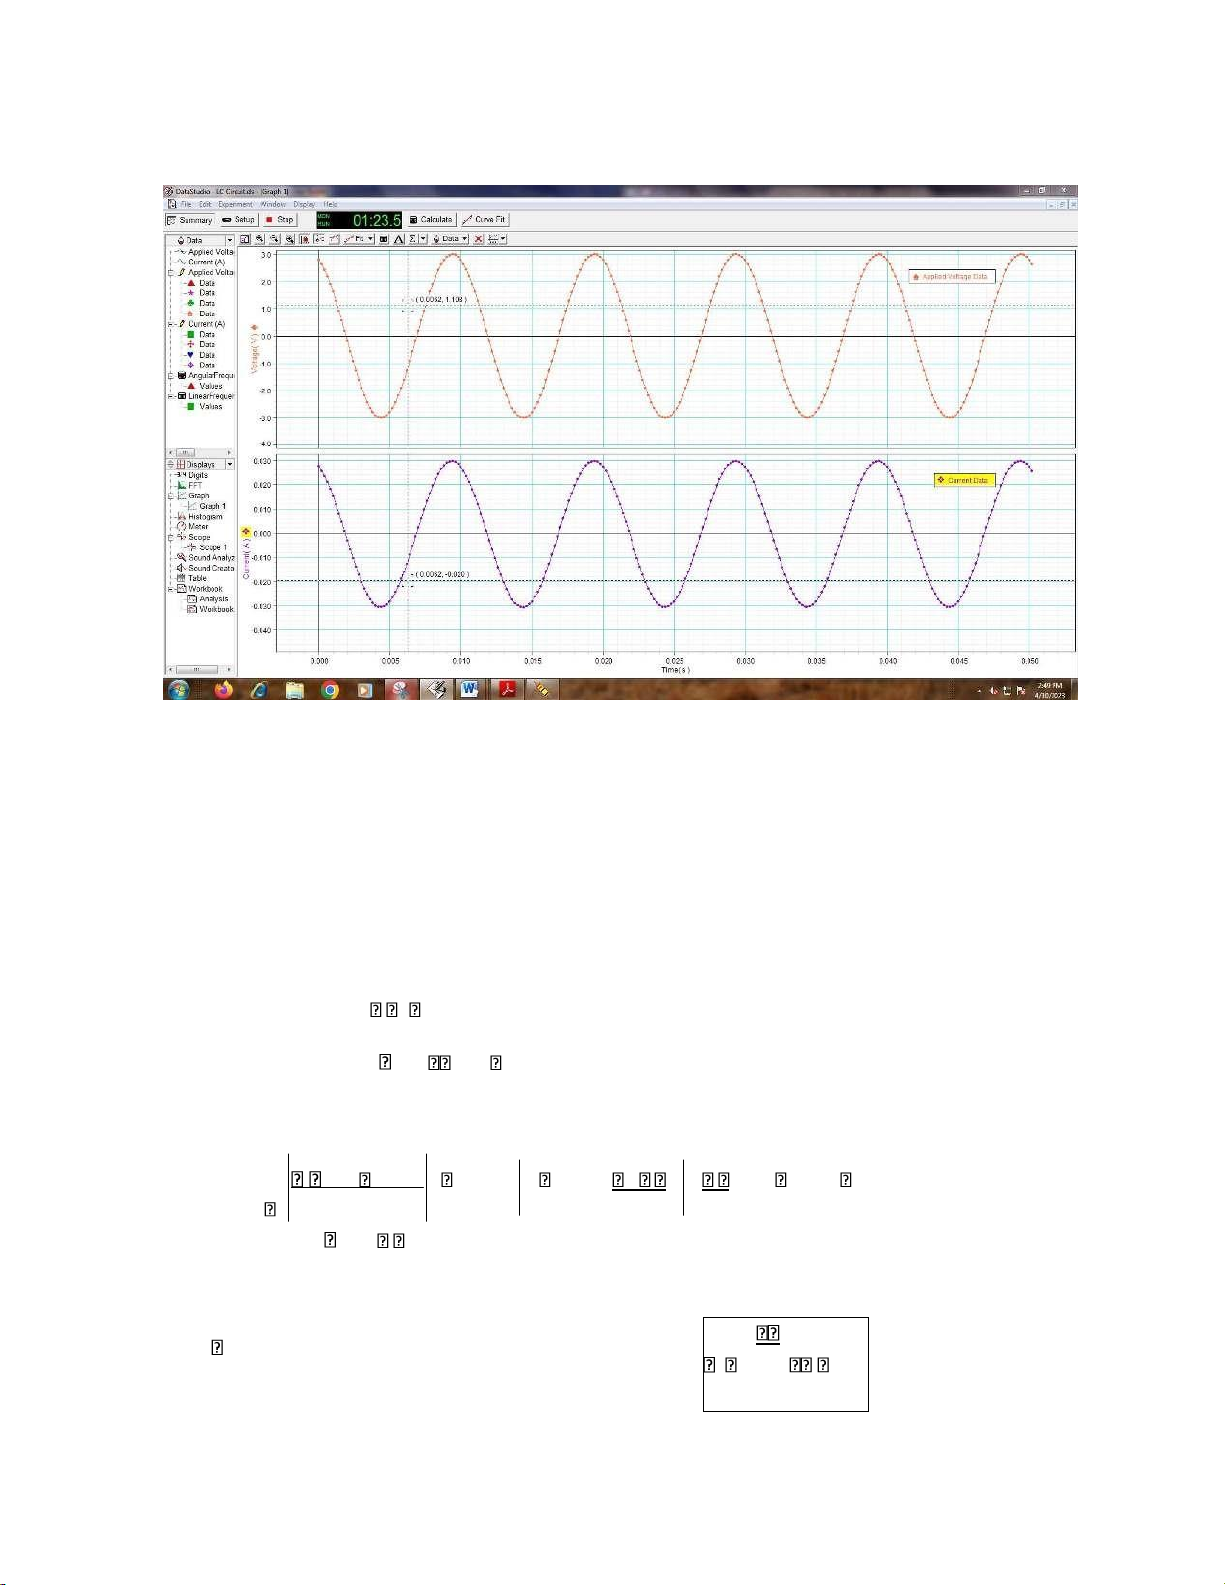
LC Oscillations experiment verified the theory: Resistive Circuit Resistance: R = 100Ω
Period of the AC voltage: T = 0.01s
Time at max/min current: t I_max = 0.0122s
Time at max/min voltage: t V_max = 0.0122s Time difference: t = 0s Phase difference: R_exp 0
Compare the phase difference with the value predicted by theory: R_exp R theo_ 0
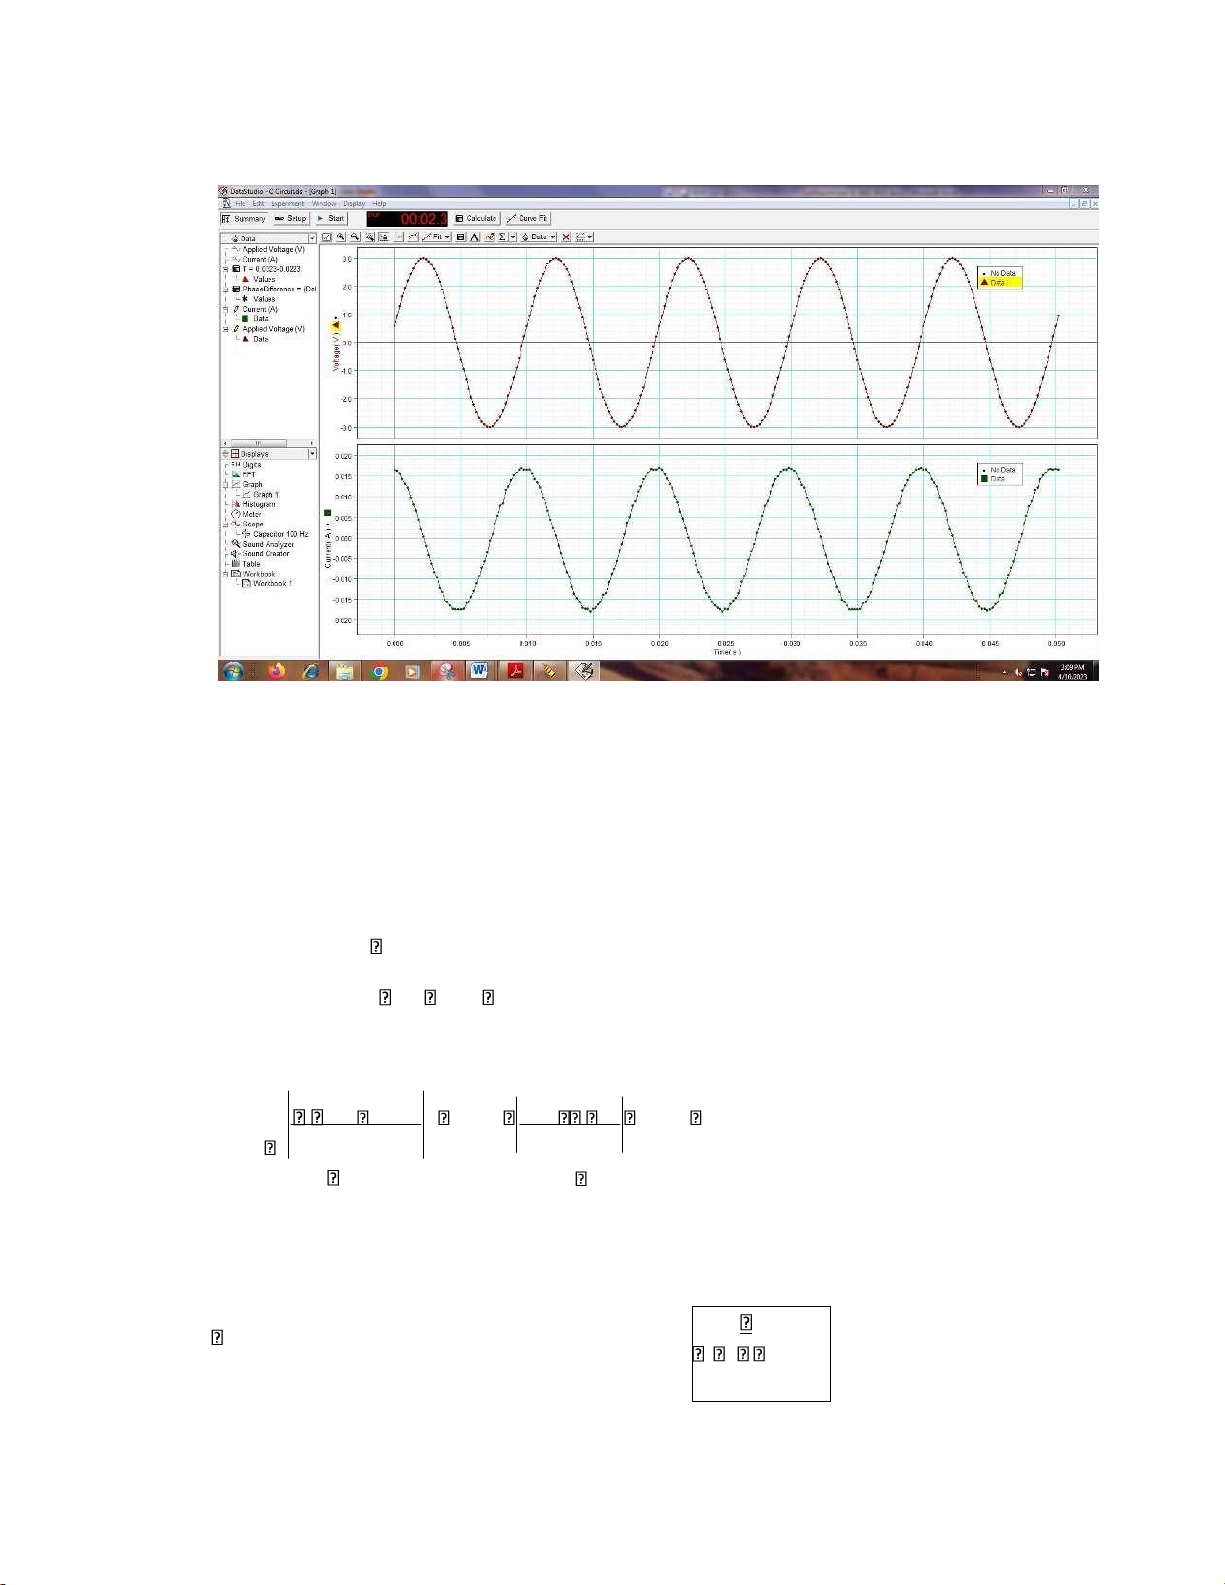
Resistive Circuit experiment verified the theory: R 0 lOMoARcPSD|364 906 32 3. Capacitive Circuit Capacitance: C = 10uF
Period of the AC voltage: T = 0.01s
Time at max/min current: t I_max = 0.0096s
Time at max/min voltage: t V_max = 0.0122s Time difference: t 0.0026s Phase difference: C _exp 93.6
Compare the phase difference with the value predicted by theory: C _exp C theo_ 100% ( 93.6 ) ( 90 ) 100% 4% Error C theo_ 90
The error <10%, which is acceptable
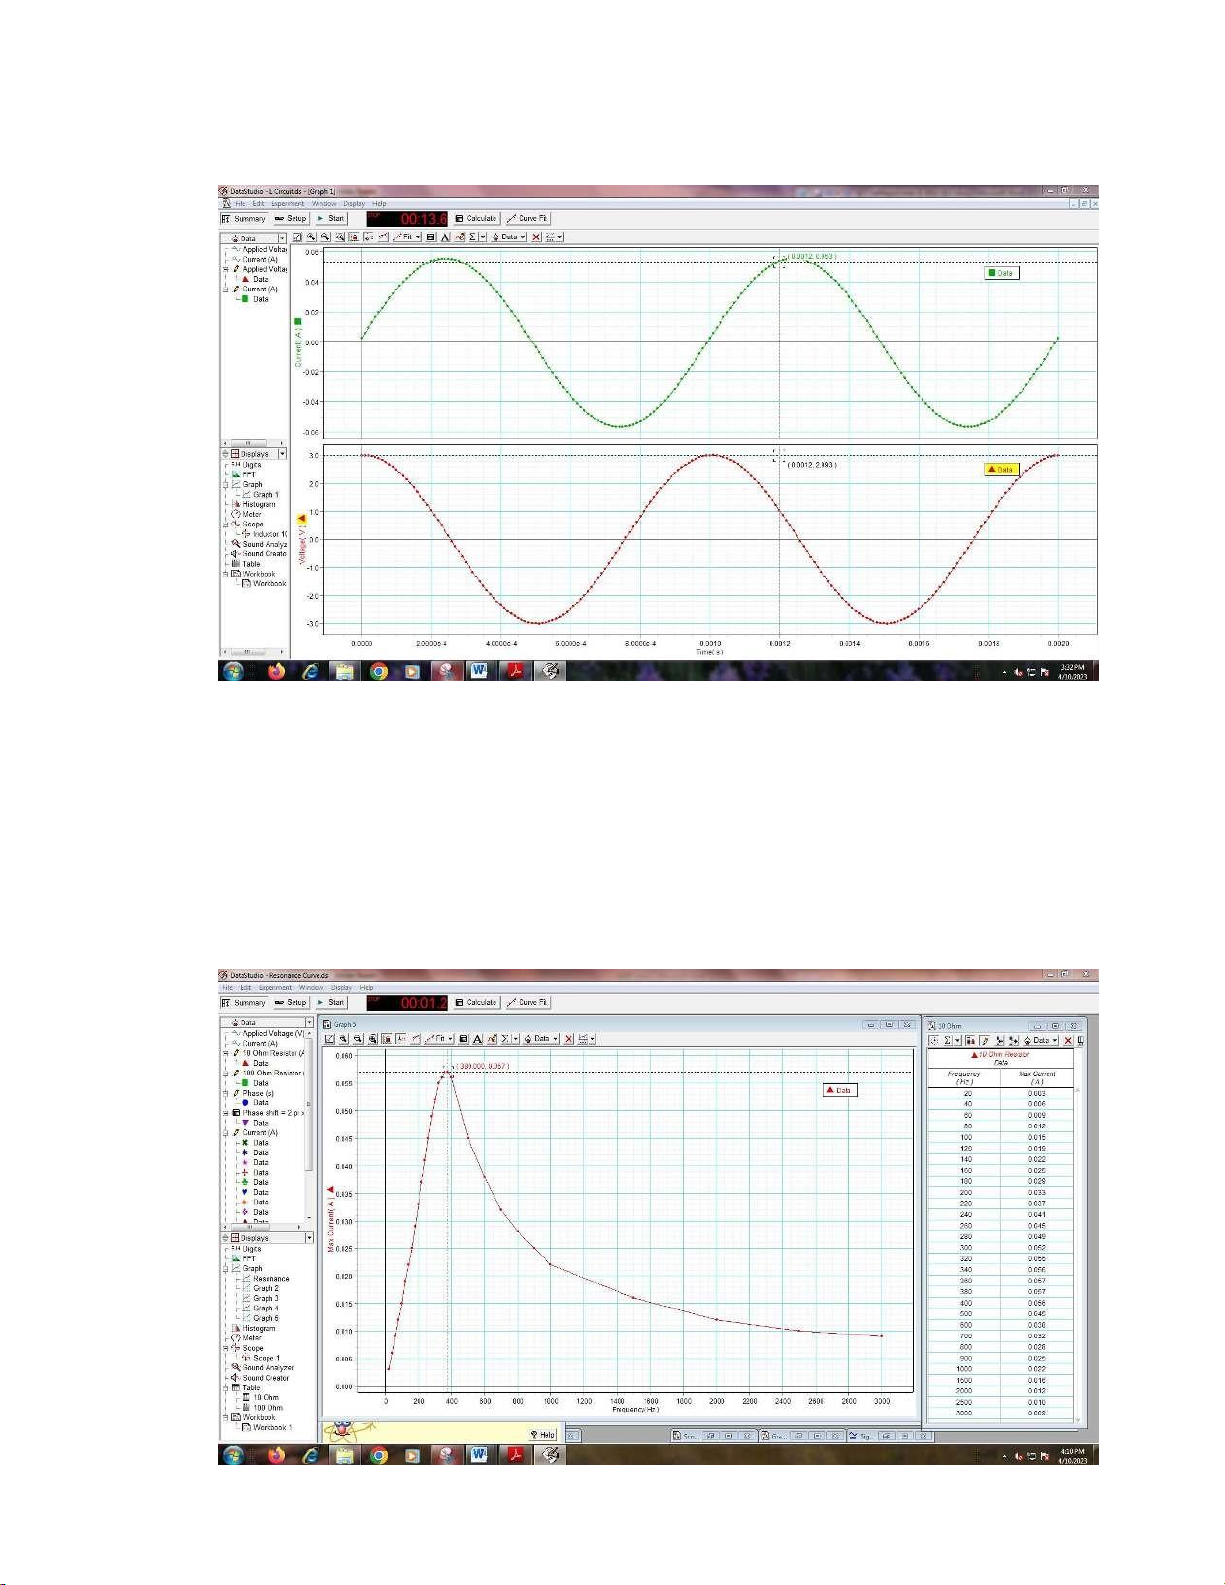
Capacitive Circuit experiment verified the theory: C ( 90 ) 2 lOMoARcPSD|364 906 32 4. Inductive Circuit Inductance: L = 0.028H
Period of the AC voltage: T = 0.001s
Time at max/min current: t I_max = 0.00074s
Time at max/min voltage: t V_max = 0.00051s Time difference: t = 0.00023s Phase difference: L_exp 82.8
Compare the phase difference with the value predicted by theory: L_exp L theo_ 100% 82.8 90 100% 8% Error L theo_ 90
- The error is caused due to the non-ideal inductor, which includes resistance inside,
making the circuit into an RL circuit.
- The error <10%, which is acceptable
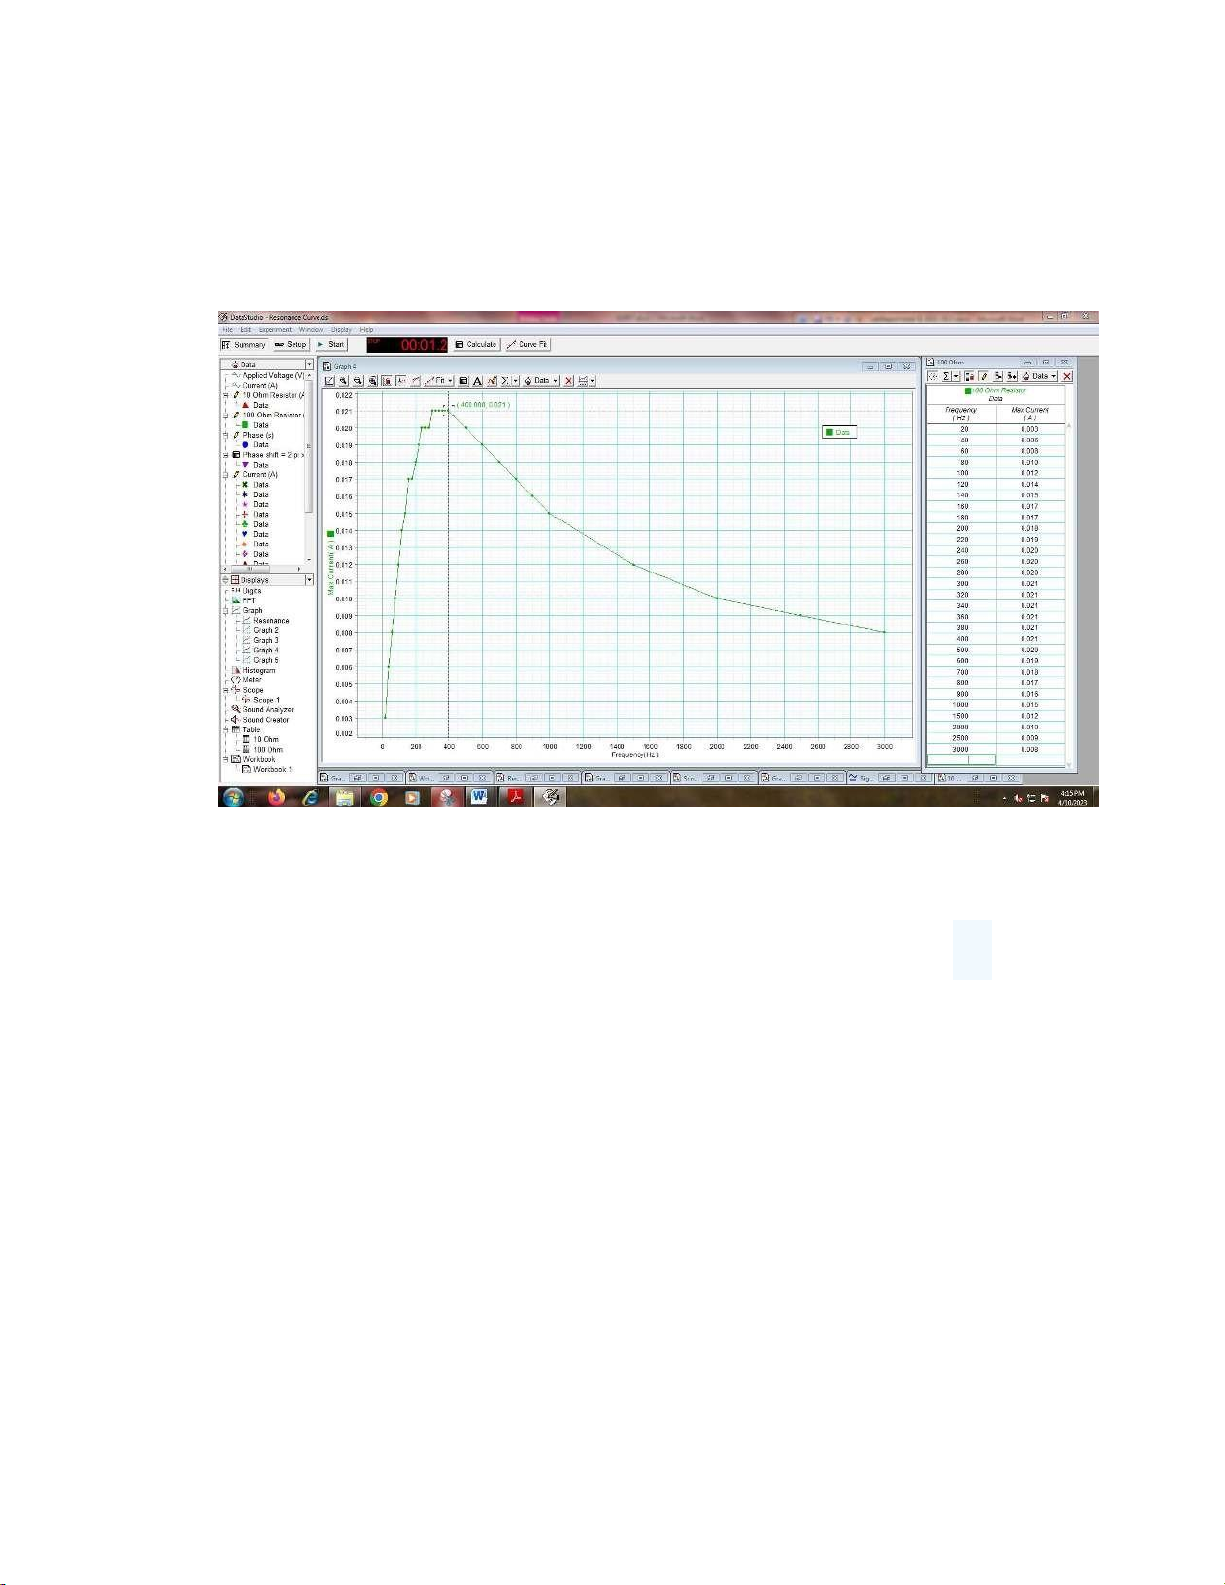
Inductive Circuit experiment verified the theory: L ( 90 ) 2 lOMoARcPSD|364 906 32 5. LRC Circuit a. Inductance: L = 0.028H Resistance: R = 10Ω Capacitance: C = 10uF
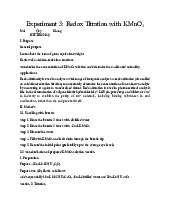
Frequency at which current reaches its max: fmax = 380 Hz lOMoARcPSD|364 906 32 b. Inductance: L = 0.028H Resistance: R = 100Ω Capacitance: C = 10uF
Frequency at which current reaches its max: fmax = 400 Hz
Compare the angular frequency in LRC circuit with the one in LC Oscillations. Does the
frequency change when the resistance changes?
- The angular frequency in the circuit compared with the angular frequency in the LC 1
oscillation is almost the same according to the formula and experiment. 𝜔 = 𝜔𝜔
- When the resistance changes, the frequency does not change because according to the
calculation formula of the frequency, there is no participation of the resistor.
Does the resistance affect the high of the peak? If yes, show your experimental data and explain.
- Peak current is calculated as voltage divided by resistance. So, the larger the resistance, the smaller the current.
In experiment a) with Resistance: R = 10Ω, the peak current is 0.057A
In experiment b) with Resistance: R = 100Ω the peak current is 0.021A
Document Outline
- LRC CIRCUITS
Tài liệu liên quan:
-
Experiment 3: Redox titration with KMnO4 | Bài báo cáo học phần Chemistry Laboratory | Trường Đại học Quốc tế, Đại học Quốc gia Thành phố Hồ Chí Minh
537 269 -
A Report - Laboratory experiment 1 : Chemical reactions | Bài báo cáo học phần Chemistry Laboratory | Trường Đại học Quốc tế, Đại học Quốc gia Thành phố Hồ Chí Minh
625 313 -
A Report - Laboratory experiment 3 : Redox titration | Bài báo cáo học phần Chemistry Laboratory | Trường Đại học Quốc tế, Đại học Quốc gia Thành phố Hồ Chí Minh
360 180 -
A Report - Laboratory experiment 2 : pH and Buffers | Bài báo cáo học phần Chemistry Laboratory | Trường Đại học Quốc tế, Đại học Quốc gia Thành phố Hồ Chí Minh
554 277 -
Chemistry laboratory report experiment 4 | Bài báo cáo học phần Chemistry Laboratory | Trường Đại học Quốc tế, Đại học Quốc gia Thành phố Hồ Chí Minh
662 331