Review Evaluation 2 - Toán Kinh Tế | Trường Đại học Tôn Đức Thắng
Question: Given a random variable X (number of products sold in a day) with a probability distribution table:X 10 20 30 40 P(x) 0.2 0.3 0.4 0.1What is the average amount sold in a day, knowing that the selling priceof a product is 100 thousand VND per day? Tài liệu được sưu tầm và soạn thảo dưới dạng file PDF để gửi tới các bạn sinh viên cùng tham khảo, ôn tập đầy đủ kiến thức, chuẩn bị cho các buổi học thật tốt. Mời bạn đọc đón xem!
Môn: Toán Kinh Tế (C01120) 81 tài liệu
Trường: Trường Đại học Tôn Đức Thắng 4.5 K tài liệu
Tác giả:


Preview text:
Question 1: Given the folllowing distribution. X 10 20 30 40 P(x) 0.2 0.3 0.4 0.1
The expected and variance values of X (respectively) are a/ 24 and 84 b/ 25 and 9.165 c/ 30 and 85 d/ 100 and 93.33 ANS: A
Question 2: Given the folllowing distribution. X 10 20 30 40 P(x) 0.2 0.3 0.4 0.1
Suppose that Z = -2X + 3. Then the expected and variance values of Z respectively are a/ - 45 and 336 b/ - 45 and 339 c/ - 45 and 168 d/ 100 and 93.33
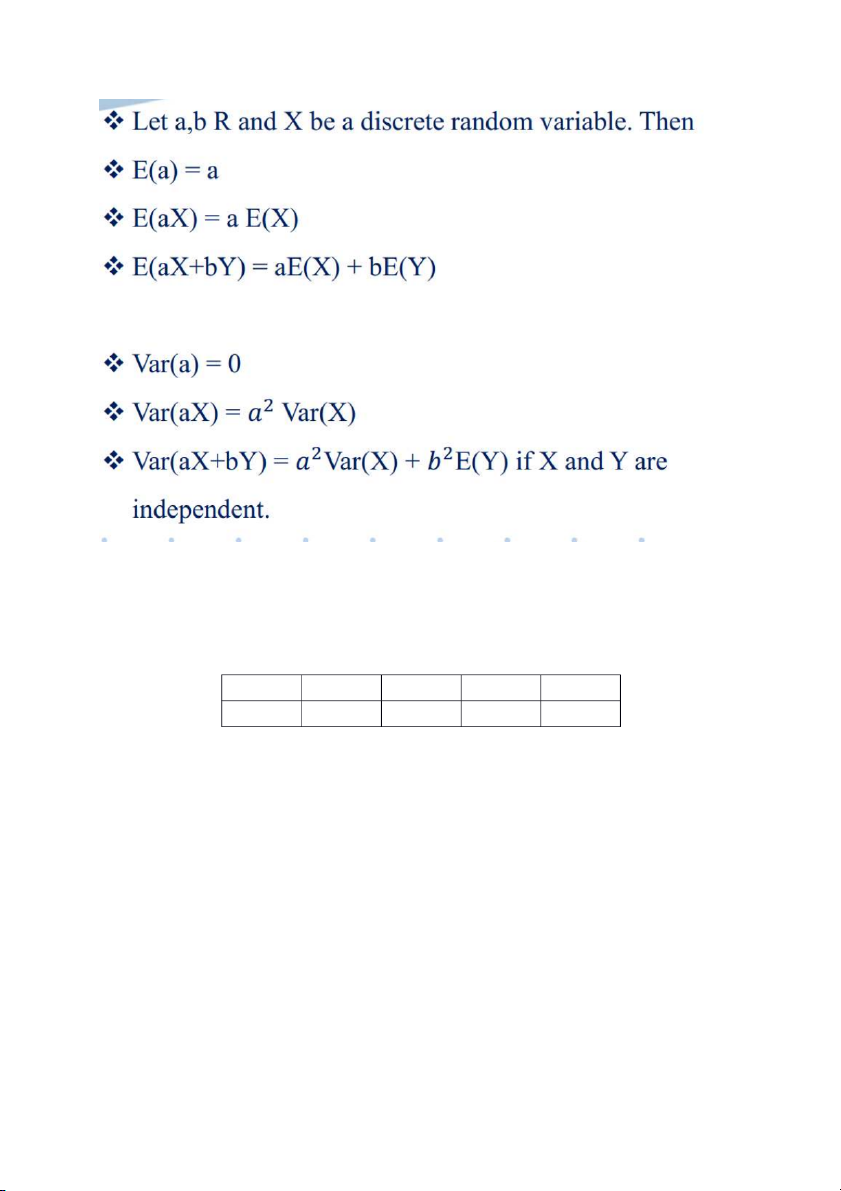
E(Z) = E(-2X +3) = E(-2X) +E(3) = -2E(X) + 3 = -2*24 + 3 = -45?
Var(Z) = Var(-2X +3) = Var(-2X) + Var(3) = 4*Var(X) + 0 = 4*84 = 336 ANS: A
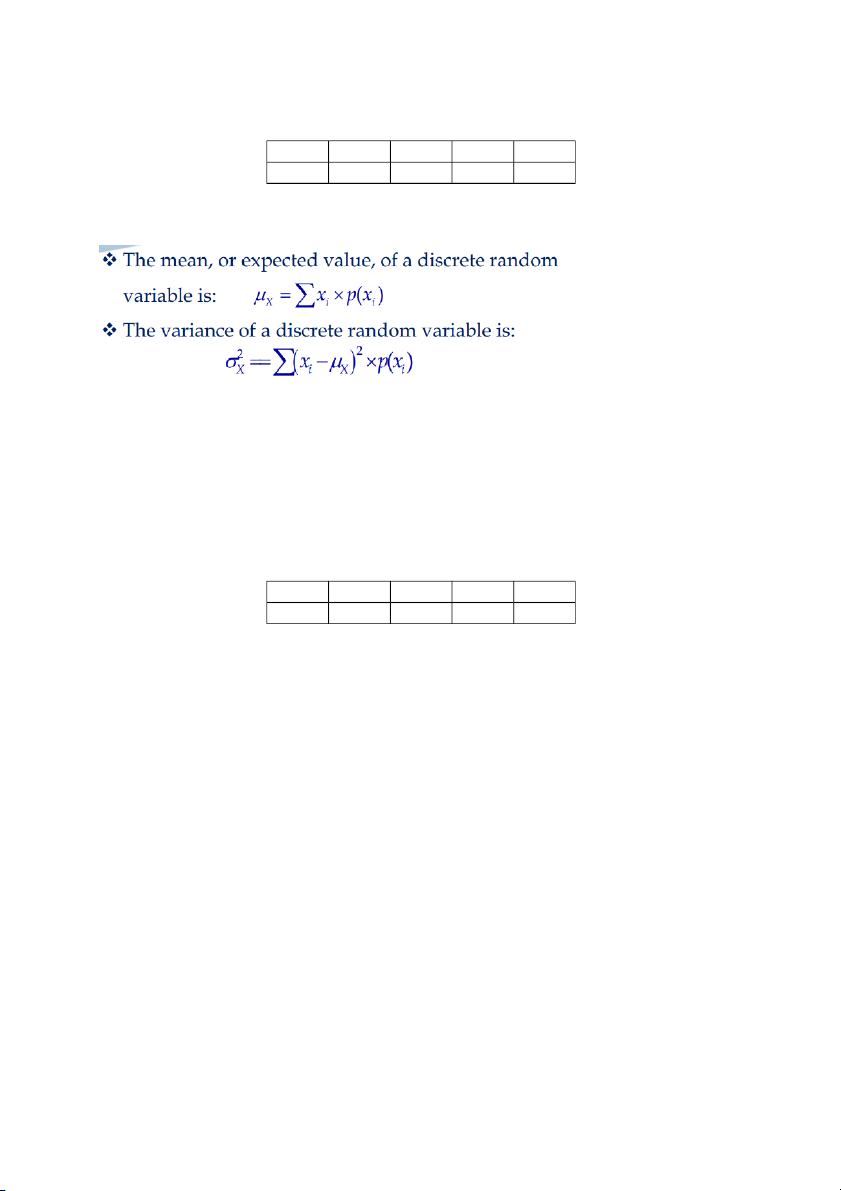
Question: Given a random variable X (number of products sold
in a day) with a probability distribution table: X 10 20 30 40 P(x) 0.2 0.3 0.4 0.1
What is the average amount sold in a day, knowing that the selling price
of a product is 100 thousand VND per day? a/100*24 thousand VND per day. b/ c/ d/
Question 3: Ten percent of the items produced by a machine are
defective. Out of 15 items chosen at random, what is the
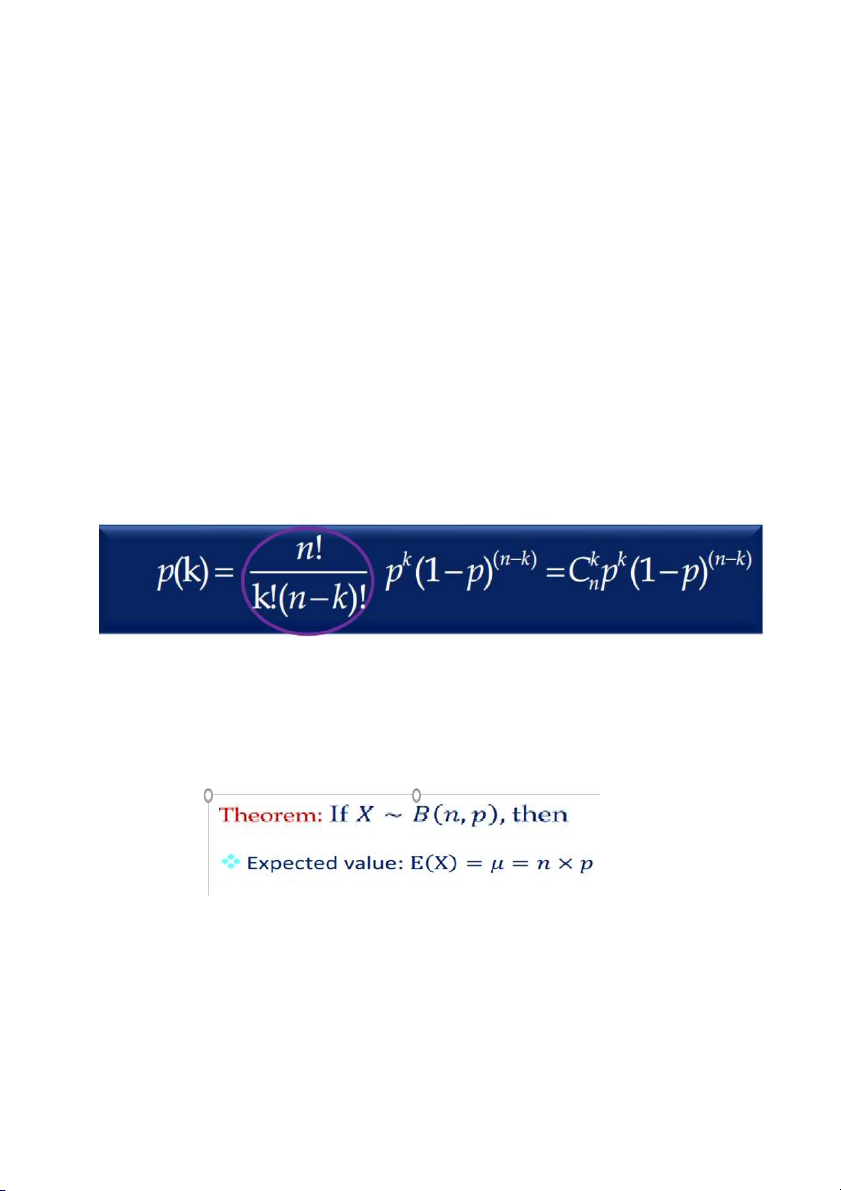
probability that exactly/ 3 items will be defective? a/ 0.129 b/ 0.456 c/ 0.871 d/ 0.237
X~B(15; 0.1), where X be the number of defective items in ….
Question: Ten percent of the items produced by a machine are
defective. Out of 150 items chosen at random. The average number of defective iterms is X~B(150; 0.1), a/15 = 150*0.1 b/ c/ d/
Question 4: X is a normally distributed random variable with a
mean of 5 and a variance of 4. The probability that X is greater than 10.52 is a/ 0.0029 b/ 0.0838 c/ 0.4971 d/ 0.9971 ANS: A X~N(5;4)
Hint: P(X>10.52) = 1- P(X<10.52) = X 5 10.52 5 1 P 1 P Z 2.76 1 0.9971 2 2 2 Given that X~N( ; )
a/ Form #1: Determine P(X< a) =? Explain: X a X a X a We have X a a P X a P P Z Then (Based on Table 1) X Z ~ N 0,1 where .
b/ Form #2: P(X>a) = 1- P(Xc/ Form#3: P(a Form #1 Chapter 6
Question 1: How will the confidence interval be affected
if the confidence level increases from 95% to 97% for the same sample data? s s ; x z ; x z x ; E x E 1 2 2 2 n n z P Z z 1 2 is determined by 2 2 (table 1)
Example: x_tb = 5; E1 = 1- (confidence interval (4; 6)
x_tb = 5; E1 = 2- (confidence interval (3; 7) wider/larger a/ b/ c/ d/
Question 2: A company has a new process for manufacturing
large artificial sapphires. In a trial run, 37 sapphires are
produced. The mean weight for these 37 gems is 6.75 carats,
and the standard deviation is 0.33 carat.
A 95% confidence interval for the for the distribution of all mean weight
sapphires produced by the new process is s s ; x z ; x z x ; E x E 1 2 2 2 n n a/ (6.64; 6.86) carats. b/ (5.54; 5.86) carats. c/ (3.34; 6.86) carats. d/ (6.64; 7.86) carats.
Question 3: The quality control manager at a factory manufacturing light bulbs is
interested to estimate the average life of a large shipment of light bulbs. The population
standard deviation is known to be 100 hours. A random sample of 50 light bulbs gave a
sample average life of 350 hours. A 95% confidence interval estimate of the true average
life of light bulbs in the shipment is ; x z ; x z x ; E x E 1 2 2 2 n n a/ (322.28; 377.72) hours. b/ c/ d/
Question 4: Consider a random sample size of 31, with sample
mean of 45.2 and sample standard deviation of 5.3. W ith 95%
confidence level, the margin of error is (s) E z2 n a/ 1.87 b/ 0.17 c/ 0.95 d/ 2.45 Question 5:
A survey of 100 Americans reports that 65% of them own a car.
With a 95% confidence level, what is the margin of error for
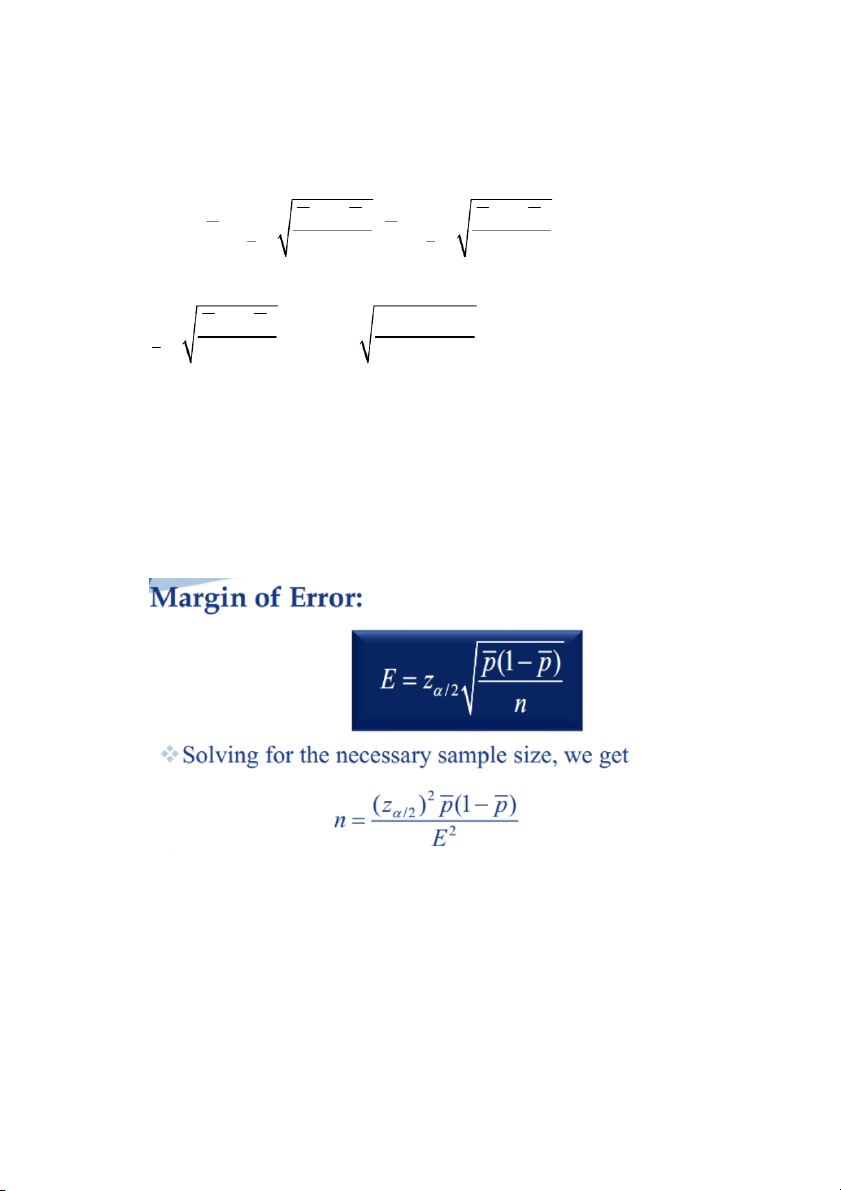
confidence interval in this example? p(1 p) p(1 p) p ;p p z ; p z 1 2 2 2 n n p(1 p) E z The margin of error, 2 n z P Z z 1 Where 2 is determined by 2 2 a/0.093 b/ 0.052 c/ 0.087 d/0.012 Question 6:
In a random sample of 50 intramural basketball players at a
large university, the average points per game was 8 points,
with a standard deviation of 2.5 points and a 95% confidence level.
Which of the following statements about the mean points
scored by all intramural basketball payers is correct? a/ (7.3; 8.7) points b/ (7.7; 8.4) points. c/ (5.5; 10.5) points. d/ (7.6; 8.4) points. Question 7:
A university planner is interested in determining the
percentage of spring semester students who will attend
summer school. She takes a pilot sample of 160 spring
semester students discovering that 56 will return to summer school.
Using the results of the pilot study with a 95% confidence level, p(1 p) p(1 p) p ;p p z ; p z 1 2 2 2 n n The margin of error, p(1 p) 0.35* 0.65 E z 1.96 0.074 7.4% 2 n 160
How large of a sample would have to be taken to provide
a margin of error of 3% or less? a/ 972 b/ c/ d/ Question 8:
A random sample of 49 lunch customers was taken at a
restaurant. The average amount of time the customers in the
sample stayed in the restaurant was 45 minutes with a standard deviation of 14 minutes.
With a 95% level of confidence, how large of a sample would
have to be taken to provide a margin of error of 2.5 minutes or less? (s) E z The margin of error: 2 n a/121 b/ c/ d/
Question: Assume that test scores from the college entrance exam are
normally distributed with a mean of 4.5 and a standard deviation of 1.
What is the test score (x0) so that 98.5% of candidates have test scores below that score (x0)? Sol: X~N(4.5; 1^2) P(X x ) 0.985 0 X 4.5 x 4.5 0 P( ) 0.985 1 1 x 4.5 0 P Z 0.985 1 x 4.5 0 2.17 x 2.17 4.5 6.67 0 1 Chapter 7:
Question 10: A company manufactures ball bearings for precision machines. The
average diameter of a certain type of ball bearing should be 6.0 mm. To check that the
average diameter is correct, the company formulates a statistical test. What should be used for the hypotheses? H : 6.0 0 H : 6.0 a/ a H : 6.0 0 H : 6.0 b/ a H : 6.0 0 H : 6.0 c/ a H : 6.0 0 H : 6.0 d/ a
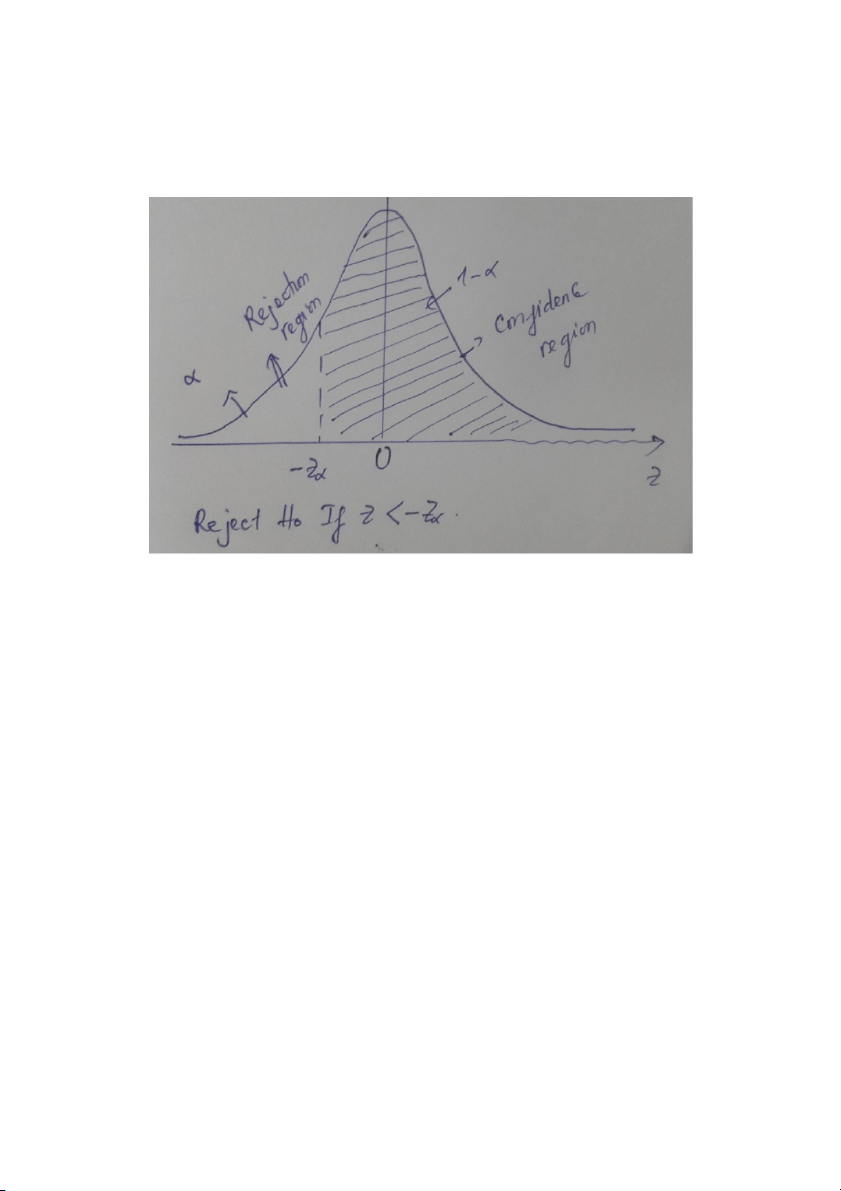
Question 11: Given the following information below. H : p 0.42 0 The hypotheses: H : p 0.42 a and the test statistic is 0.
Refer to the above information, at the level of signifcance of 5%, the correct conclusion is
Z(alpha) = 1.64, the test statistic Z = 0
- do not reject H0 (we tend to accept H0)
a/ the proportion of the population is not greater than 42%.
b/ the proportion of the population is greater 42%.
c/ the proportion of the population equals to 42%.
d/ Not enough information given to answer this question.
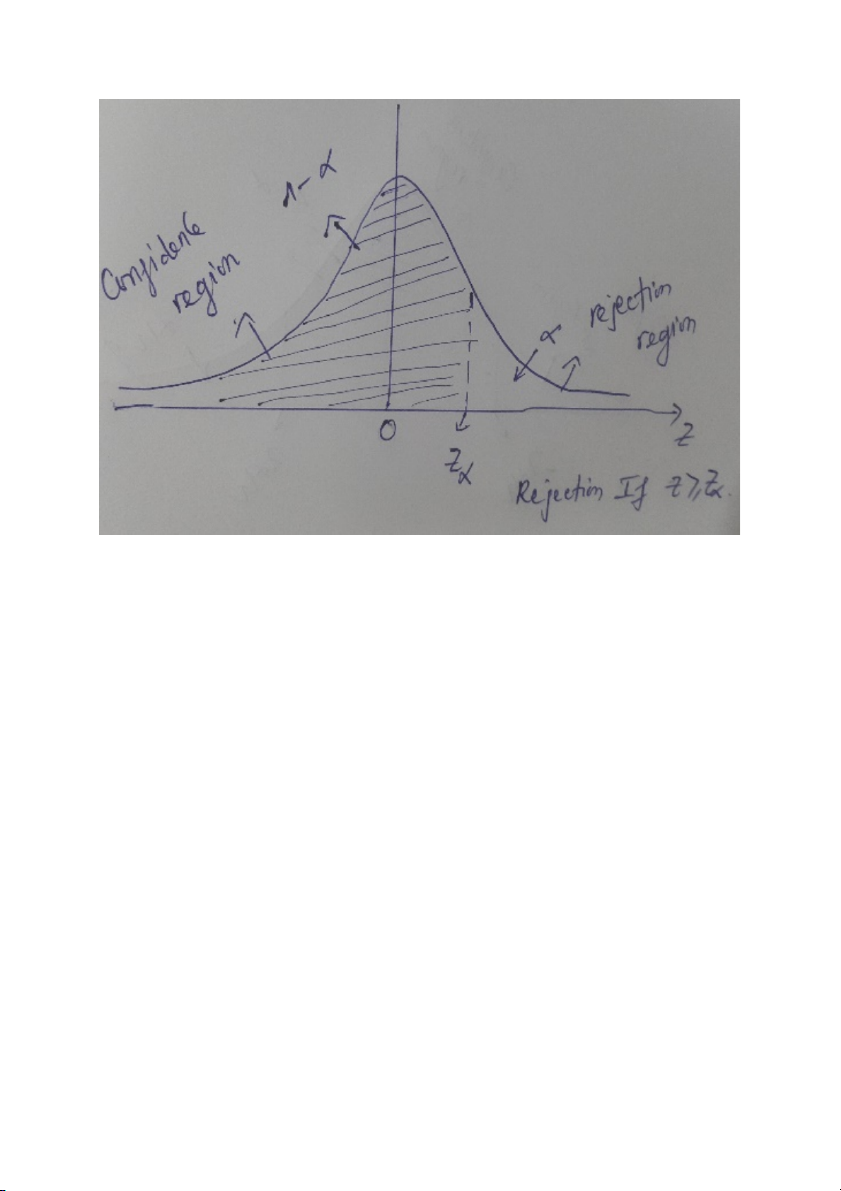
Question : In a test of H : 100 against H : 100, 0 a the sample data
yielded the test statistic Z = 2.17. At 5% level of significance, your
conclusion about the population mean is Z= 2.17; Z(alpha) = 1.64
Do not reject H0 ( we tend to accept H0).
a/ significantly greater than or equal to 100.
b/ significantly less than or equal 100.
c/ Not enough information given to answer this question. d/ significantly equal to 100. Chapter 8
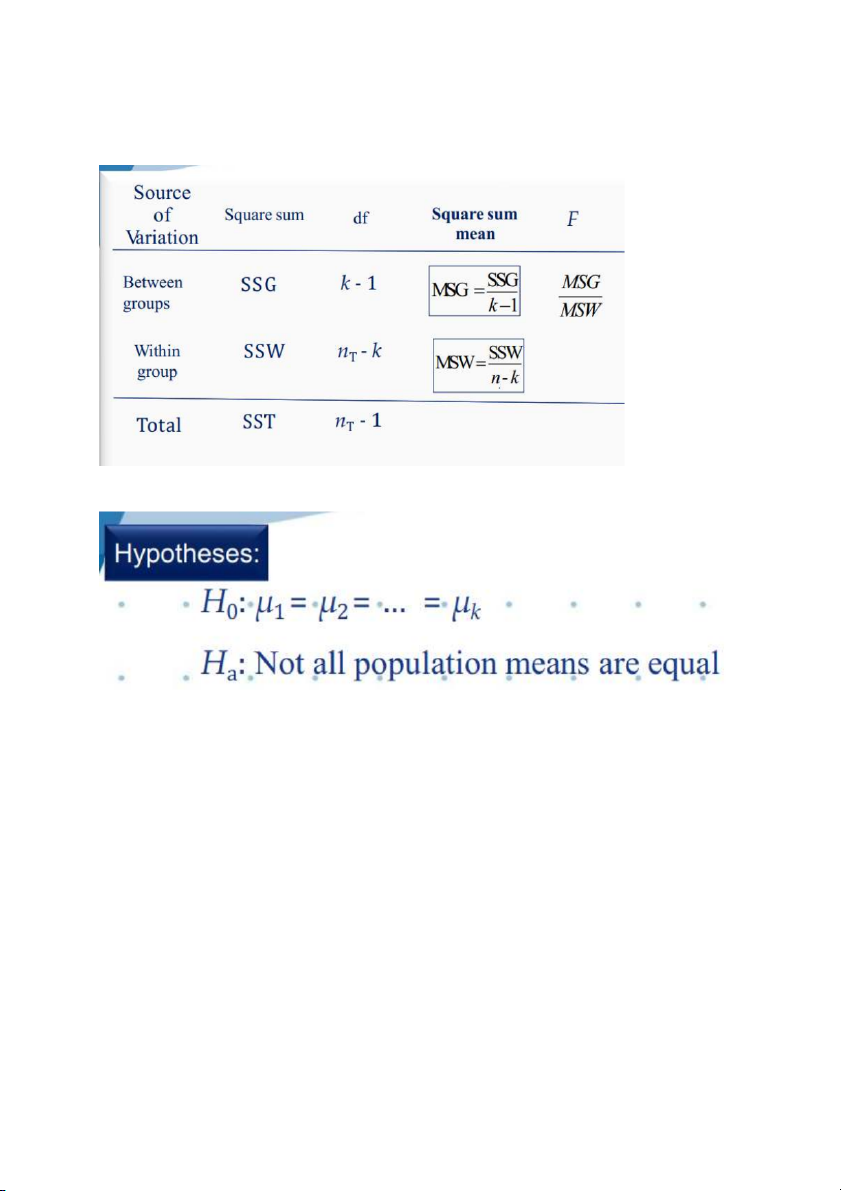
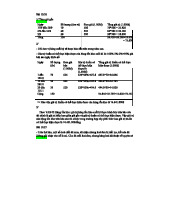
Question . Given the following ANOVA table. Source of Sum of Degrees of Mean Variation Squares Freedom Square F Between groups 36 2 ---- ? Error (Within Groups) 240 __-----_ ----- Total ------ 42
Refer to the above table, the test statistic (F) is a/ 3 b/ 2 c/ 10 d/ 13
Question : Given the following ANOVA table. Source of Sum Degrees Mean Variation of of Squares Squares Freedom F Between groups 1,500 2 750 5 Within groups 4500 --- 150 Total 6,000 32
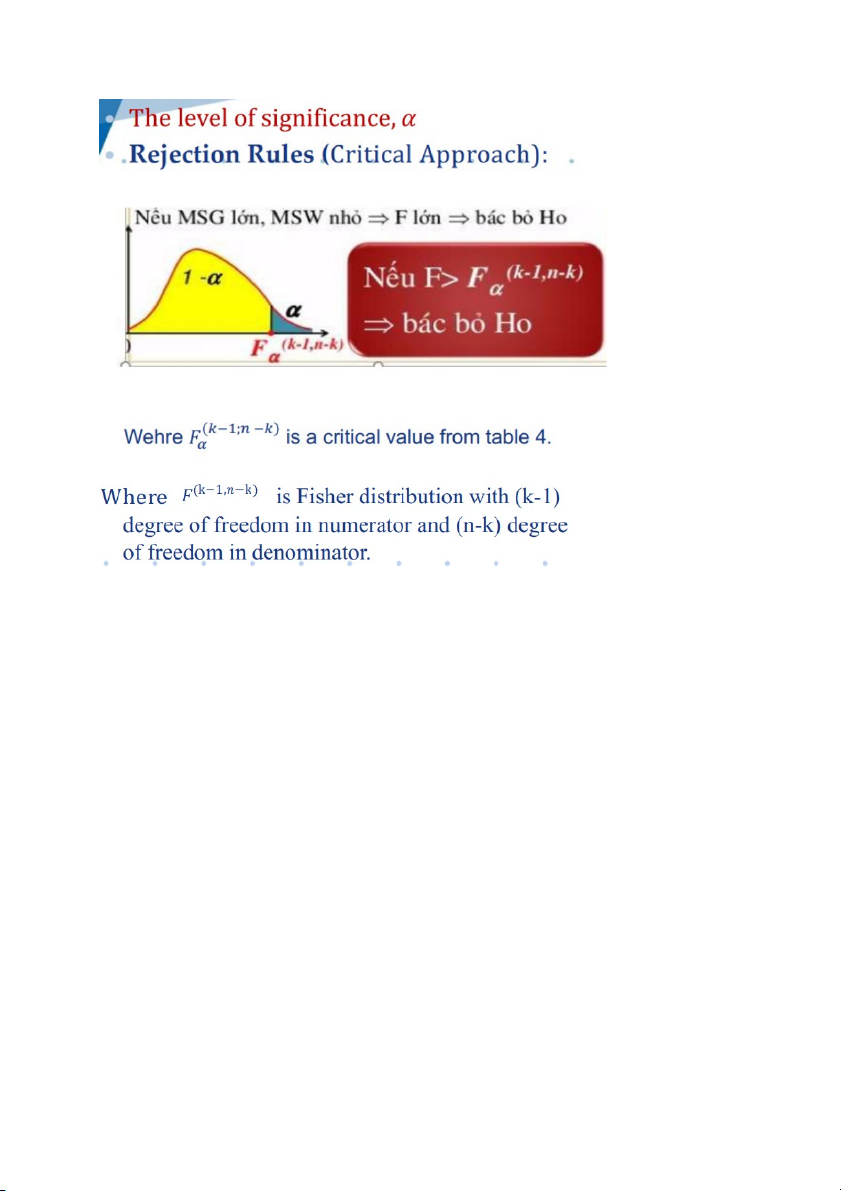
Refer to the above table, the null hypothesis is to be tested at the 5% level of significance,
The null hypothesis is to be tested at the 5% level of significance, your conclusion is
a/ one mean is different from the others. b/ c/ d/
The critical value F(k-1; n-k) = F(2; 30) at the level of significance of 5% is 3.32.
Since F= 5 > the critical value F(k-1; n-k) = F(2; 30) = 3.32, therefore reject H0.
Tài liệu liên quan:
-

Chương 1 Ma trận và hệ phương trình
19 10 -
Bài tập Kiểm toán BCTC Chương 2: Hàng tồn kho và Ghi nhận Doanh thu
111 56 -

Bài giảng toán kinh tế chương 3 | Trường Đại học Tôn Đức Thắng
156 78 -

Bài giảng chương 4 hàm hai biến | Toán kinh tế
146 73 -

Bài giảng chương 1: ma trận và các phép toán | Toán kinh tế
123 62