Study Questions for Econ Final Exam | Microeconomics | Trường Đại học Quốc tế, Đại học Quốc gia Thành phố Hồ Chí Minh
UsedemandandSupplymodeltoforecastaboutnewequilibriumpoint,then showthechangeonpriceandquantity. 1. There is a new published research about the benefit of eating more apples. However, due to effect of the bad weather, farmers harvest less apples. 2. Due to a rise in income, consumers demand more beef. At the same time, an outbreak of animal disease. Tài liệu được sưu tầm và soạn thảo dưới dạng file PDF để gửi tới các bạn cùng tham khảo, ôn tập đầy đủ kiến thức, chuẩn bị cho các buổi học thật tốt. Mời bạn đọc đón xem!
Môn: Microeconomics 635 tài liệu
Trường: Trường Đại học Quốc tế, Đại học Quốc gia Thành phố Hồ Chí Minh 1.9 K tài liệu
Tác giả:

Preview text:
STUDY QUESTIONS FOR FINAL EXAM I.
Use demand and Supply model to forecast about new equilibrium point, then
show the change on price and quantity.
1. There is a new published research about the benefit of eating more
apples. However, due to effect of the bad weather, farmers harvest less apples.
2. Due to a rise in income, consumers demand more beef. At the same
time, an outbreak of animal disease reduces cattle supply
3. A new technology significantly reduces production costs of
smartphones. At the same time, smartphones become more popular
due to the expansion of online learning and remote work.
4. The government promotes electric vehicles through consumer
awareness campaigns. Simultaneously, producers benefit from
economies of scale and improved battery technology.
5. A new scientific study reports that excessive sugar consumption is
harmful to health. At the same time, beverage producers ( which
contain sugar as an material) adopt new production technology that lowers production costs.
6. The government discourages plastic bag usage through environmental
campaigns. Meanwhile, manufacturers of reusable bags expand
production capacity due to lower material costs.
7. Household income rises, and laptops are a normal good. Meanwhile,
new firms enter the laptop market due to lower entry barriers.
8. Rapid population growth increases demand for rice. At the same time,
improved irrigation systems significantly raise rice productivity. II. Problems:
Problem 1: The annual demand function for apples is given by: Q =480−0. 1 P =280. D
and this year’s apple output is Qs2 (where P is measured in
dollars and Q is measured in tons).
1) Determine the market price of apples this year.
2) Suppose that last year’s apple output was Q =270 s 1 tons, and the
demand function for apples remained unchanged. Compare farmers’
income this year with that of last year.
3) To ensure farmers’ income, the government proposes two policy options:
Policy 1 (Price control):The government sets a price floor this year
at $2,100 per ton of apples and commits to purchasing all surplus apples.
Policy 2 (Subsidy):The government does not intervene in the market
price but promises to subsidize farmers $100 per ton. II.1.
Calculate The government’s expenditure under each policy II.2.
Calculate Farmers’ income under each policy II.3.
According to you, which policy is the most beneficial?
Problem 2. The domestic orange market is described by the following functions: P=3 Q+10∧P=−0.5Q+80
(P is measured in thousand VND, Q is measured in kilograms).
1. Determine the market equilibrium in the domestic orange market.
2. Suppose the government imposes an effective price control policy on
oranges at P = 64 thousand VND per kg. Will the market experience a
surplus or a shortage? Calculate the amount of surplus or shortage.
Determine which policy is that?
3. Suppose the government imposes a per-unit tax of t = 7 thousand VND per kg.
3.1. Calculate the tax revenue collected by government
3.2. Calculate the tax incident for buyers and sellers
Problem 3. The demand function for good X is given as follows Q =20−4 P +2 I−2 P X x Y where:
QX: quantity demanded of good X (units)
P :price of good X (thousand VND per unit) x
I: consumer income allocated to consumption (thousand VND per day)
PY: price of good Y, a complementary good to X (thousand VND per unit)
Suppose that this year, price of good X is 5000 VND per unit, the consumer
income (I) is 100.000 per day and price of good Y is 2000 VND.
1. Calculate the price elasticity of demand at Px
2. Calculate the income elasticity of demand at I. Which type of good X is that?
3. Calculate the cross price elasticity of demand at Py. What is the
relationship between good X and Y?
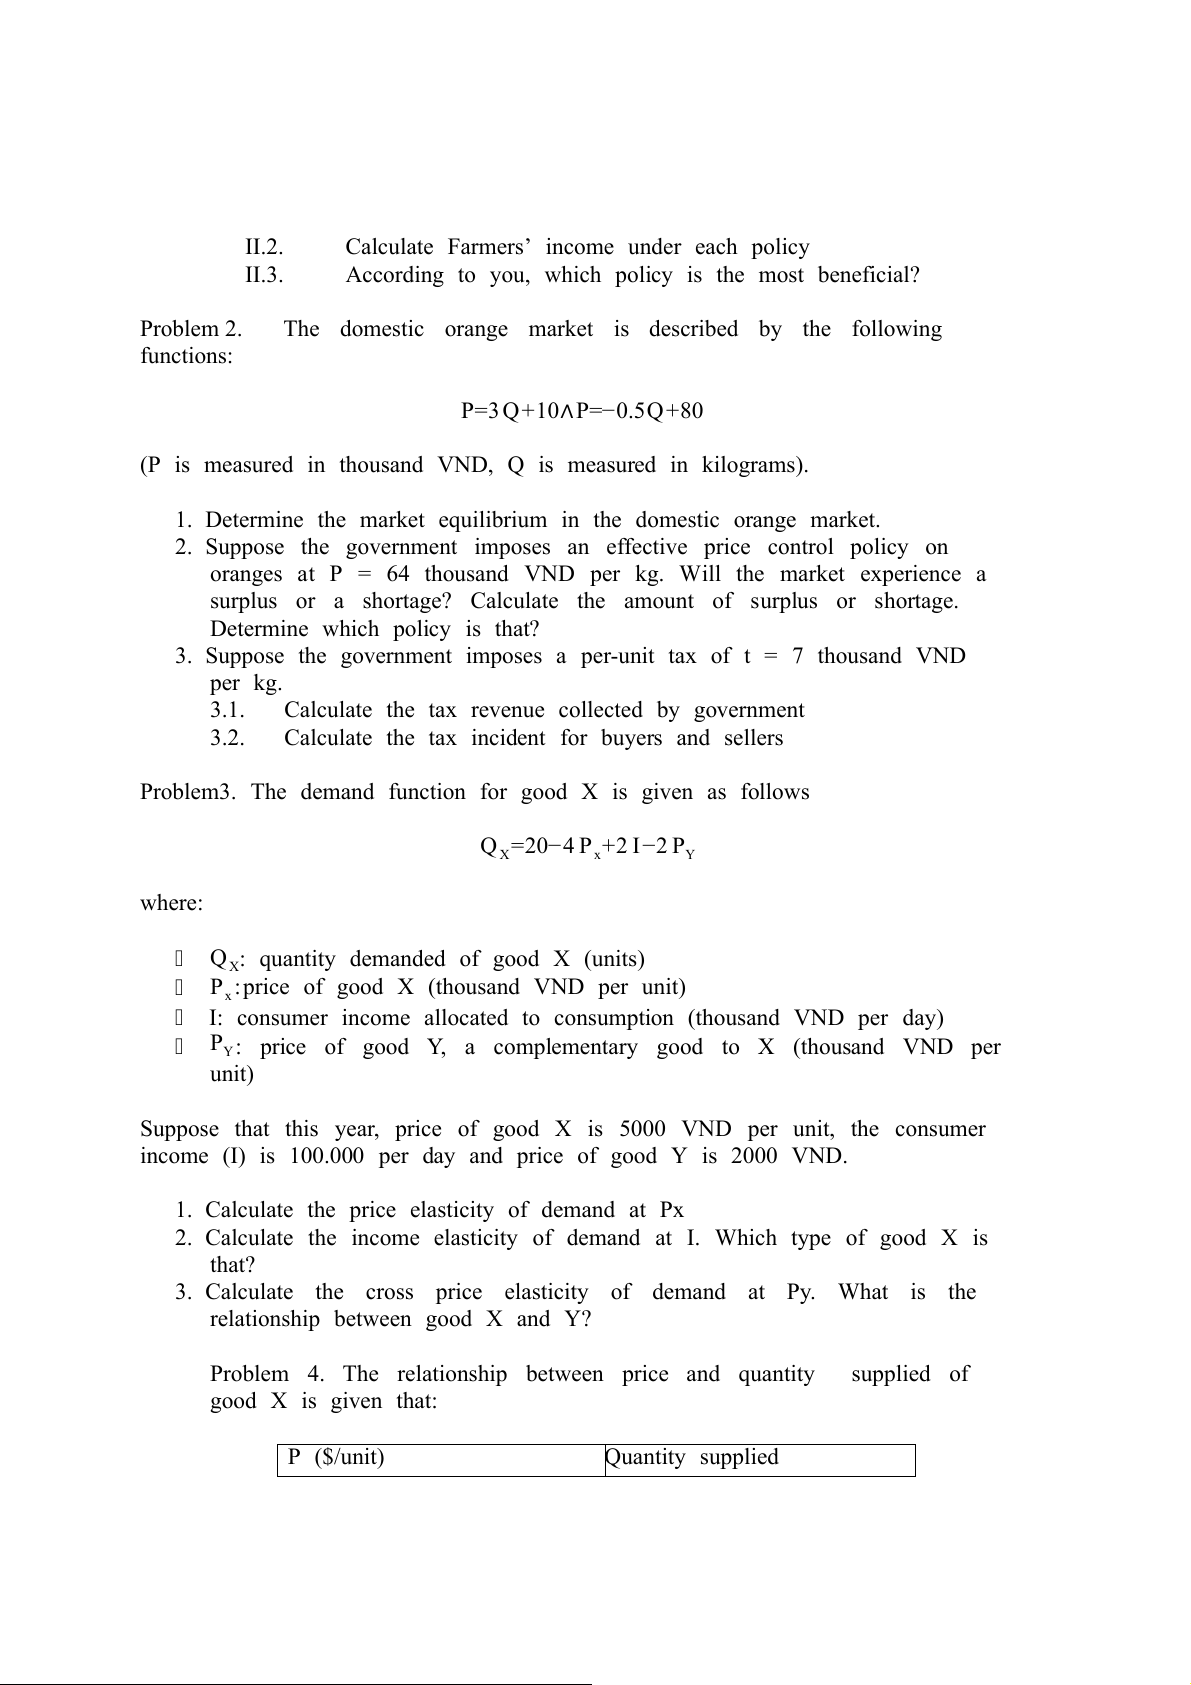
Problem 4. The relationship between price and quantity supplied of good X is given that: P ($/unit) Quantity supplied 10 40 12 50 14 60 16 70 18 80 20 90
1. Calculate the price elasticity of supply at P = 10 and P =16
( assume that the supply curve is linear)
2. Calculate the the price elasticity of supply when price change from
10 to 16 (using mid-point method)
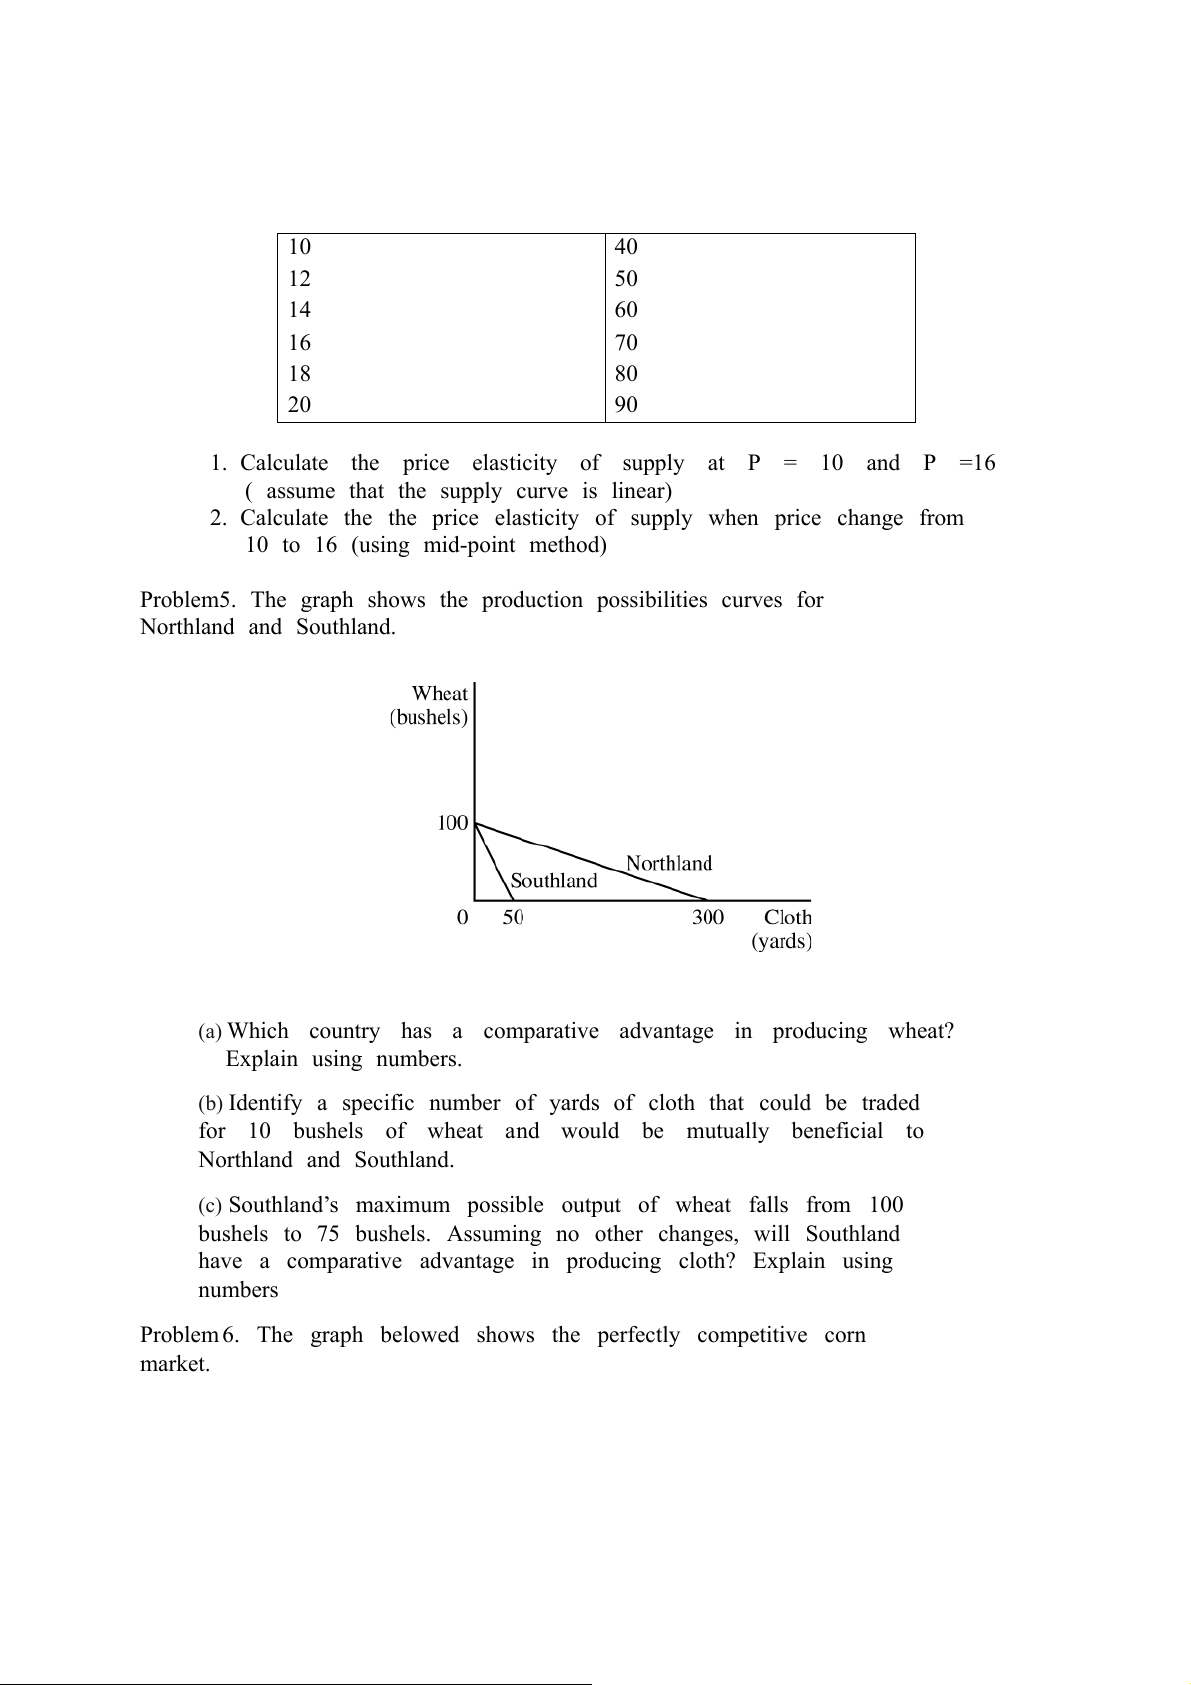
Problem 5. The graph shows the production possibilities curves for Northland and Southland.
(a) Which country has a comparative advantage in producing wheat? Explain using numbers.
(b) Identify a specific number of yards of cloth that could be traded
for 10 bushels of wheat and would be mutually beneficial to Northland and Southland.
(c) Southland’s maximum possible output of wheat falls from 100
bushels to 75 bushels. Assuming no other changes, will Southland
have a comparative advantage in producing cloth? Explain using numbers
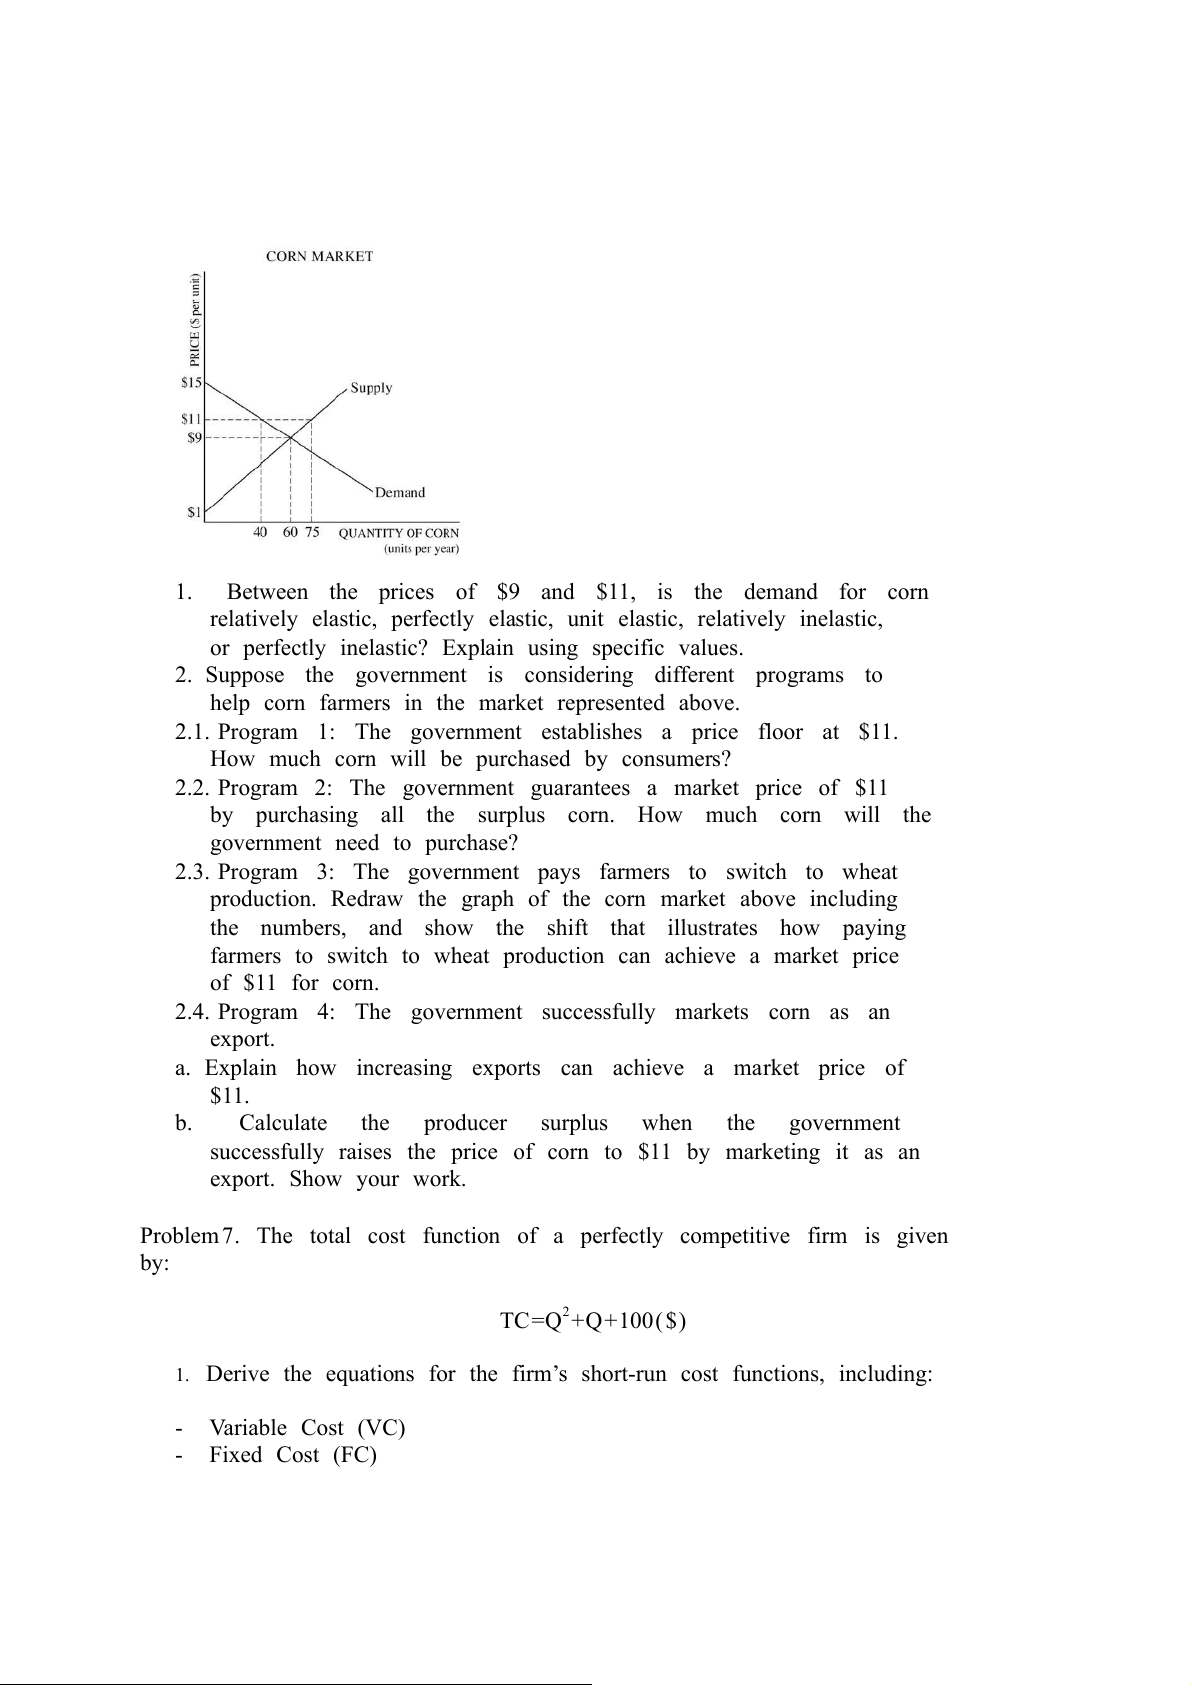
Problem 6. The graph belowed shows the perfectly competitive corn market.
1. Between the prices of $9 and $11, is the demand for corn
relatively elastic, perfectly elastic, unit elastic, relatively inelastic,
or perfectly inelastic? Explain using specific values.
2. Suppose the government is considering different programs to
help corn farmers in the market represented above.
2.1. Program 1: The government establishes a price floor at $11.
How much corn will be purchased by consumers?
2.2. Program 2: The government guarantees a market price of $11
by purchasing all the surplus corn. How much corn will the government need to purchase?
2.3. Program 3: The government pays farmers to switch to wheat
production. Redraw the graph of the corn market above including
the numbers, and show the shift that illustrates how paying
farmers to switch to wheat production can achieve a market price of $11 for corn.
2.4. Program 4: The government successfully markets corn as an export.
a. Explain how increasing exports can achieve a market price of $11.
b. Calculate the producer surplus when the government
successfully raises the price of corn to $11 by marketing it as an export. Show your work.
Problem 7. The total cost function of a perfectly competitive firm is given by: TC=Q2+Q+100($)
1. Derive the equations for the firm’s short-run cost functions, including: - Variable Cost (VC) - Fixed Cost (FC) - Average Total Cost (ATC) - Average Variable Cost (AVC) - Average Fixed Cost (AFC) - Marginal Cost (MC)
2. Determine the level of output that maximizes the firm’s profit if the market price is $27.
Calculate the maximum profit earned by the firm.
3. Determine the firm’s break-even price and break-even level of output.
4. If the market price is $9, should the firm shut down production in the
short run? Explain your answer.
Problem 8. The demand function for a monopolist as: P=55−2 Q
And the total cost is given as: TC=Q2−5 Q+100
1. Determine the profit – maximizing price and quantity
2. Calculate the consumer surplus and producer surplus. Show this area on the graph.
3. In case that the monopolist behaves as a perfectly competitive firm,
determine: The output level and price that maximize profit and the
resulting profit and consumer surplus. Show this area on the graph.
Problem 9. Soja Farm is a typical profit-maximizing firm that produces and
sells soybeans in a constant-cost, perfectly competitive market that is in
long-run equilibrium. The market equilibrium price of soybeans is $14 per bushel.
1. Draw correctly labeled side-by-side graphs for the soybean market and
for Soja Farm, and show each of the following. 1.1.
The market equilibrium price and quantity, labeled $14 and QM, respectively 1.2.
Soja Farm’s profit-maximizing price and quantity, labeled PF and QF, respectively 1.3.
Soja Farm’s average total cost curve consistent with a long-run equilibrium, labeled ATC
2. If Soja Farm is the only firm in the market that chooses to increase its
price of soybeans to $15 per bushel, will Soja Farm’s total revenue
increase by $1, remain the same, or decrease to $0 ? Explain.
3. Soybeans are used as an input in the production of tofu. Tofu now
becomes a more popular food option among consumers. On your
graphs in part (1), show the short-run effect of the increased popularity
of tofu on each of the following. 3.1.
The new market equilibrium price and quantity of soybeans,
labeled P2 and Q2, respectively. 3.2.
Soja Farm’s new profit-maximizing quantity, labeled Q*
4. Given the increase in popularity of tofu in part (3), what will happen to
the number of firms in the soybean market in the long run? Explain.
5. Suppose a 25% increase in the market price of quinoa causes a 5%
decrease in the quantity demanded of quinoa and a 10% increase in
the quantity demanded for tofu. Is the cross price of demand for
quinoa elastic, inelastic, or unit elastic? Explain using numbers.
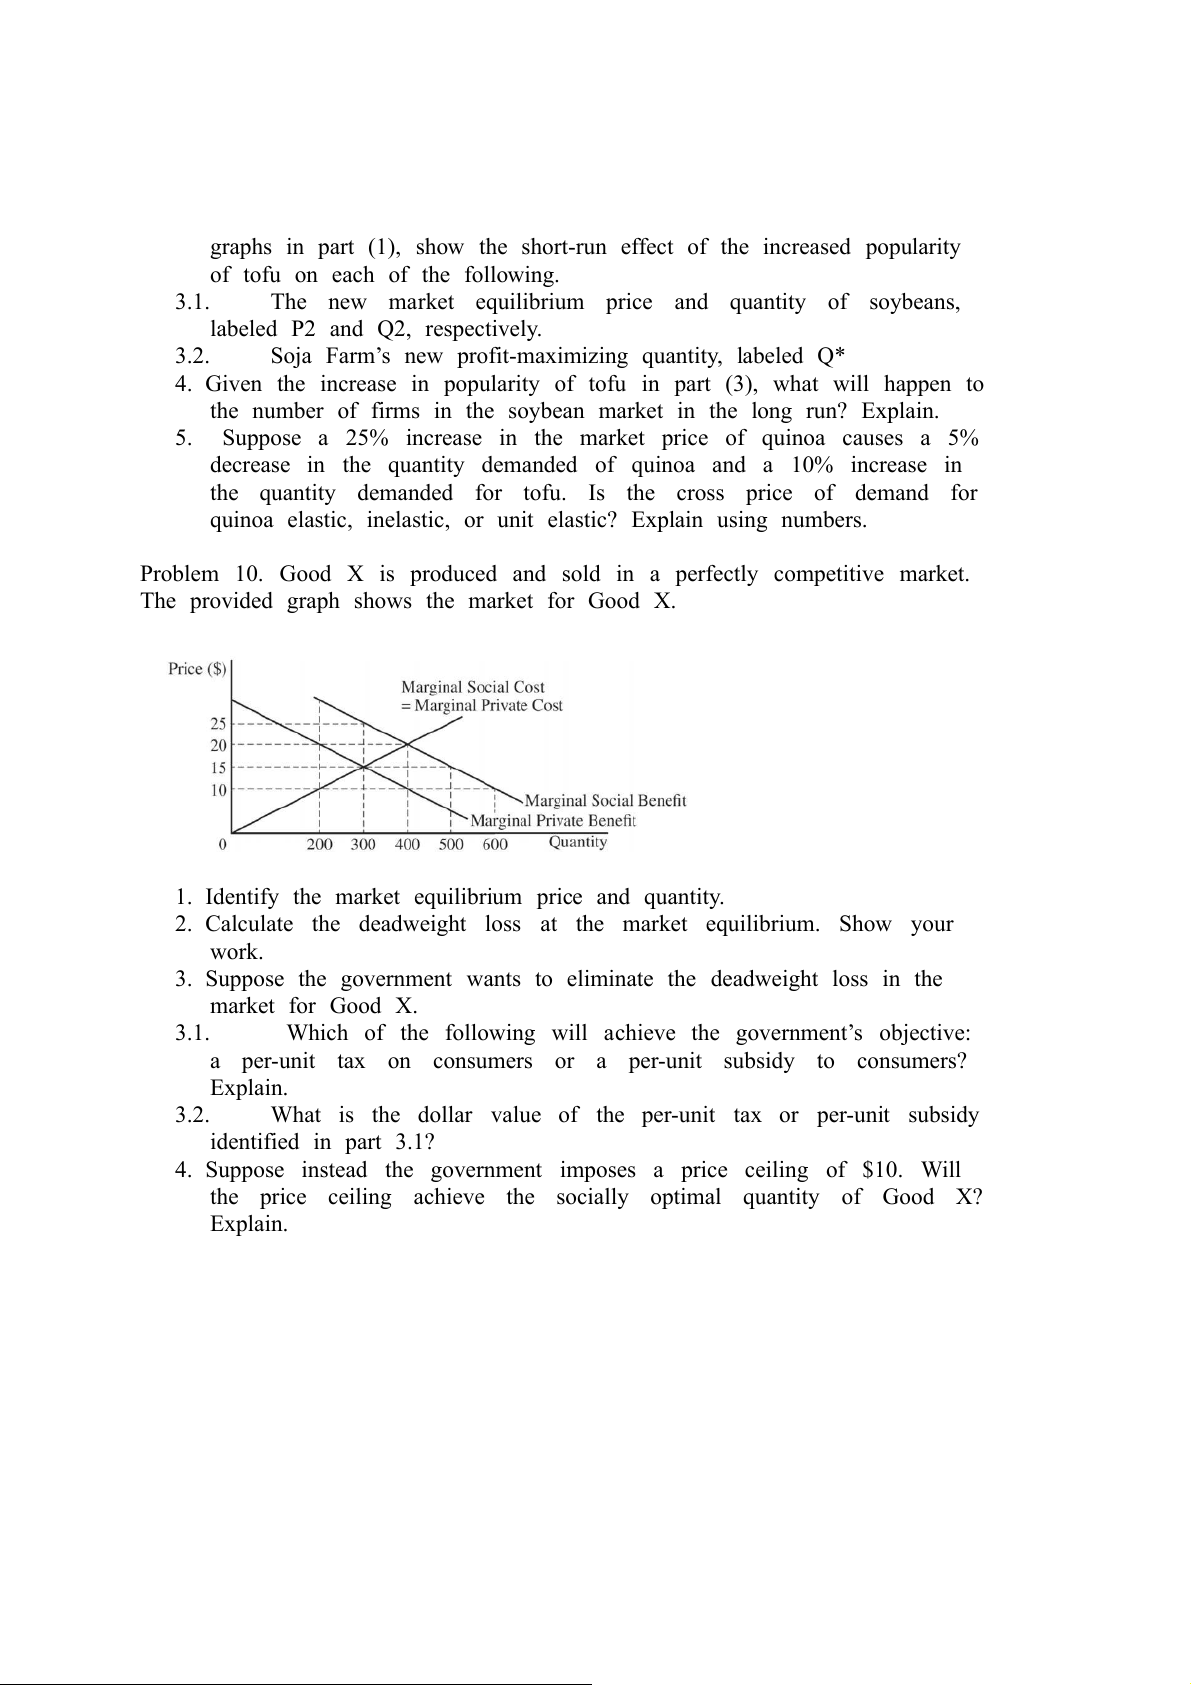
Problem 10. Good X is produced and sold in a perfectly competitive market.
The provided graph shows the market for Good X.
1. Identify the market equilibrium price and quantity.
2. Calculate the deadweight loss at the market equilibrium. Show your work.
3. Suppose the government wants to eliminate the deadweight loss in the market for Good X. 3.1.
Which of the following will achieve the government’s objective:
a per-unit tax on consumers or a per-unit subsidy to consumers? Explain. 3.2.
What is the dollar value of the per-unit tax or per-unit subsidy identified in part 3.1?
4. Suppose instead the government imposes a price ceiling of $10. Will
the price ceiling achieve the socially optimal quantity of Good X? Explain.
Tài liệu liên quan:
-

Chương 3: độ co giãn và các nhân tố ảnh hưởng | Microeconomics | Trường Đại học Quốc tế, Đại học Quốc gia Thành phố Hồ Chí Minh
4 2 -

Microeconomics Syllabus | Microeconomics | Trường Đại học Quốc tế, Đại học Quốc gia Thành phố Hồ Chí Minh
4 2 -

Microeconomics Course Syllabus & Assessment Details | Microeconomics | Trường Đại học Quốc tế, Đại học Quốc gia Thành phố Hồ Chí Minh
4 2 -

Assignment 3 - Elasticity MCQs and Key Concepts | Microeconomics | Trường Đại học Quốc tế, Đại học Quốc gia Thành phố Hồ Chí Minh
4 2 -

Assignment 2 - Economic Equilibrium Analysis of Fridges and Motorcycles | Microeconomics | Trường Đại học Quốc tế, Đại học Quốc gia Thành phố Hồ Chí Minh
4 2