Topic 3: Impact of Demand and Supply Shifts | Microeconomics | Trường Đại học Quốc tế, Đại học Quốc gia Thành phố Hồ Chí Minh
Because of the effect of Hurricane Katrina had on New orleans, about 250,000 residents had to relocated to nearby Baton Rouge. In other words, the demand for housing in Baton Rouge had increased whereas the quantity of houses in that city was limited. This led to the scarcity in the supply of houses, which pushed houses rise up (from $130,000 to $156,000). Tài liệu được sưu tầm và soạn thảo dưới dạng file PDF để gửi tới các bạn cùng tham khảo, ôn tập đầy đủ kiến thức, chuẩn bị cho các buổi học thật tốt. Mời bạn đọc đón xem!
Môn: Microeconomics 635 tài liệu
Trường: Trường Đại học Quốc tế, Đại học Quốc gia Thành phố Hồ Chí Minh 1.9 K tài liệu
Tác giả:
Preview text:
Microeconomics Full name: Doan Xuan Nhi Ex1:
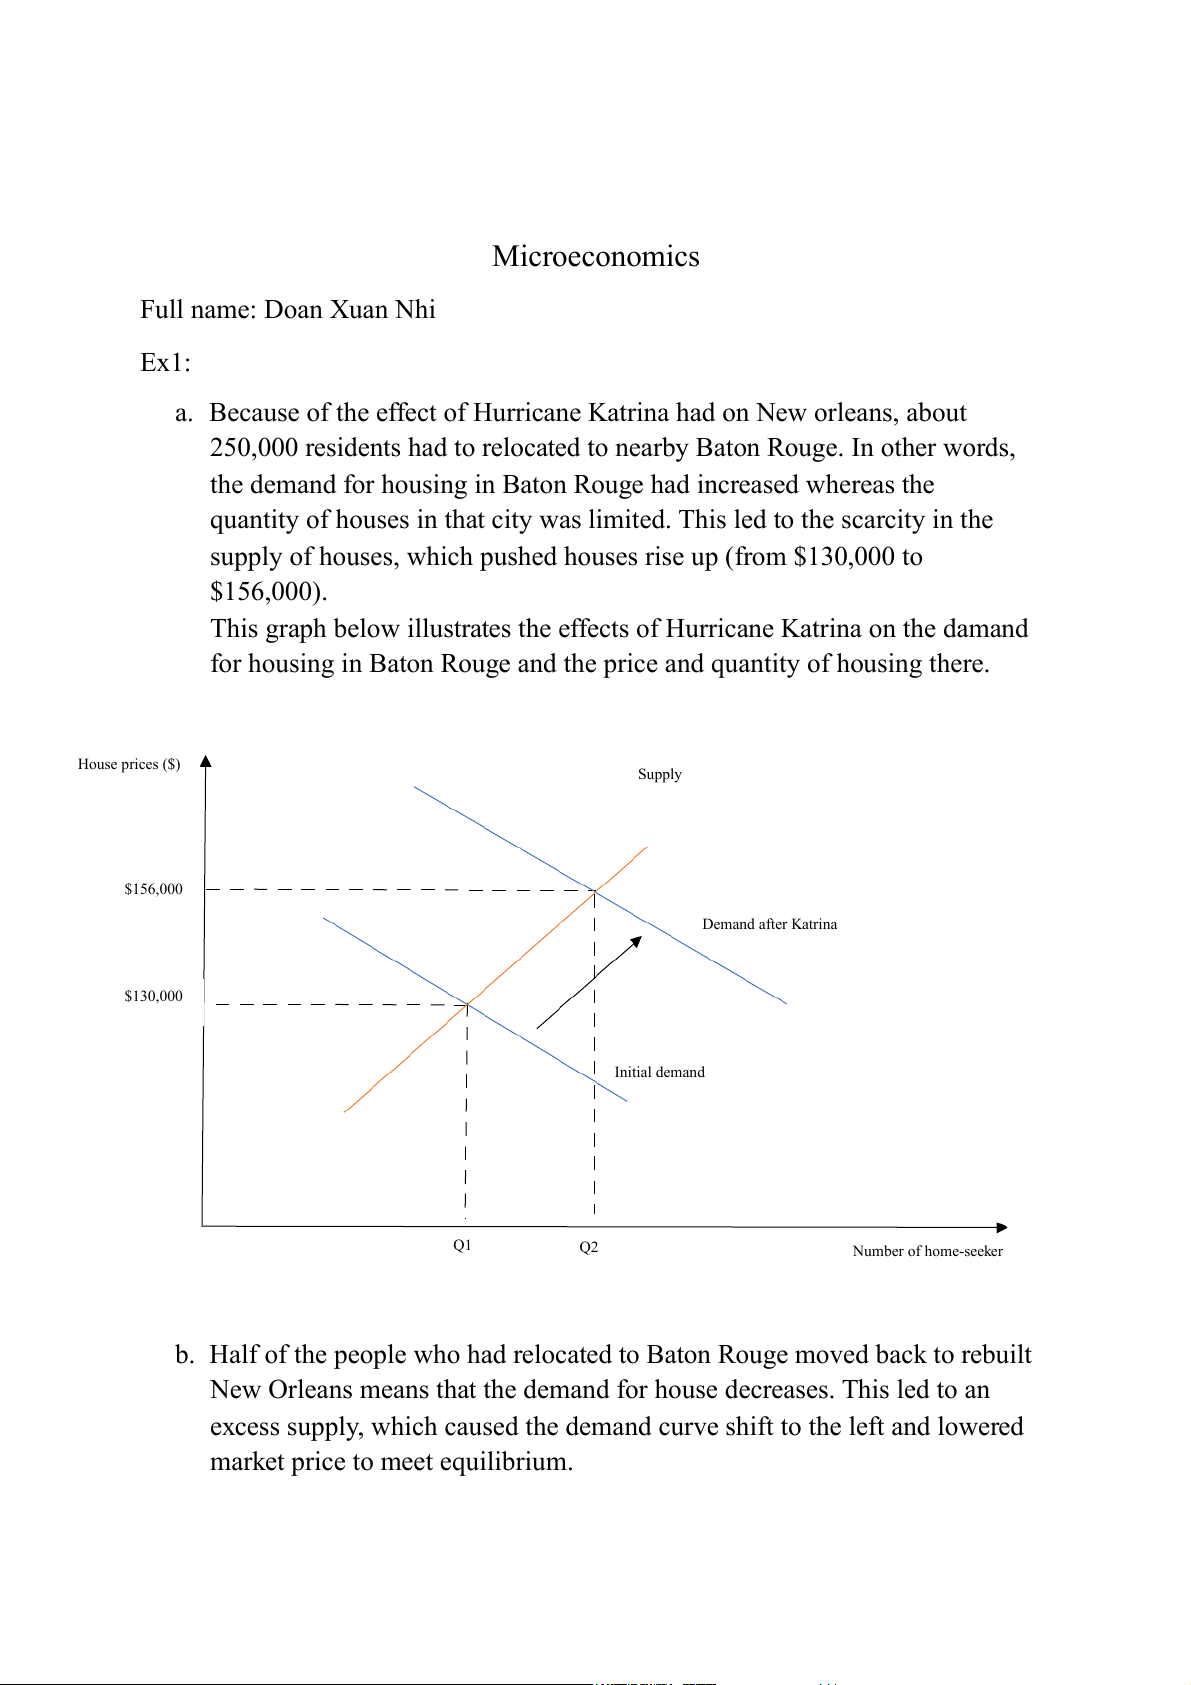
a. Because of the effect of Hurricane Katrina had on New orleans, about
250,000 residents had to relocated to nearby Baton Rouge. In other words,
the demand for housing in Baton Rouge had increased whereas the
quantity of houses in that city was limited. This led to the scarcity in the
supply of houses, which pushed houses rise up (from $130,000 to $156,000).
This graph below illustrates the effects of Hurricane Katrina on the damand
for housing in Baton Rouge and the price and quantity of housing there. House prices ($) Supply $156,000 Demand after Katrina $130,000 Initial demand Q1 Q2 Number of home-seeker
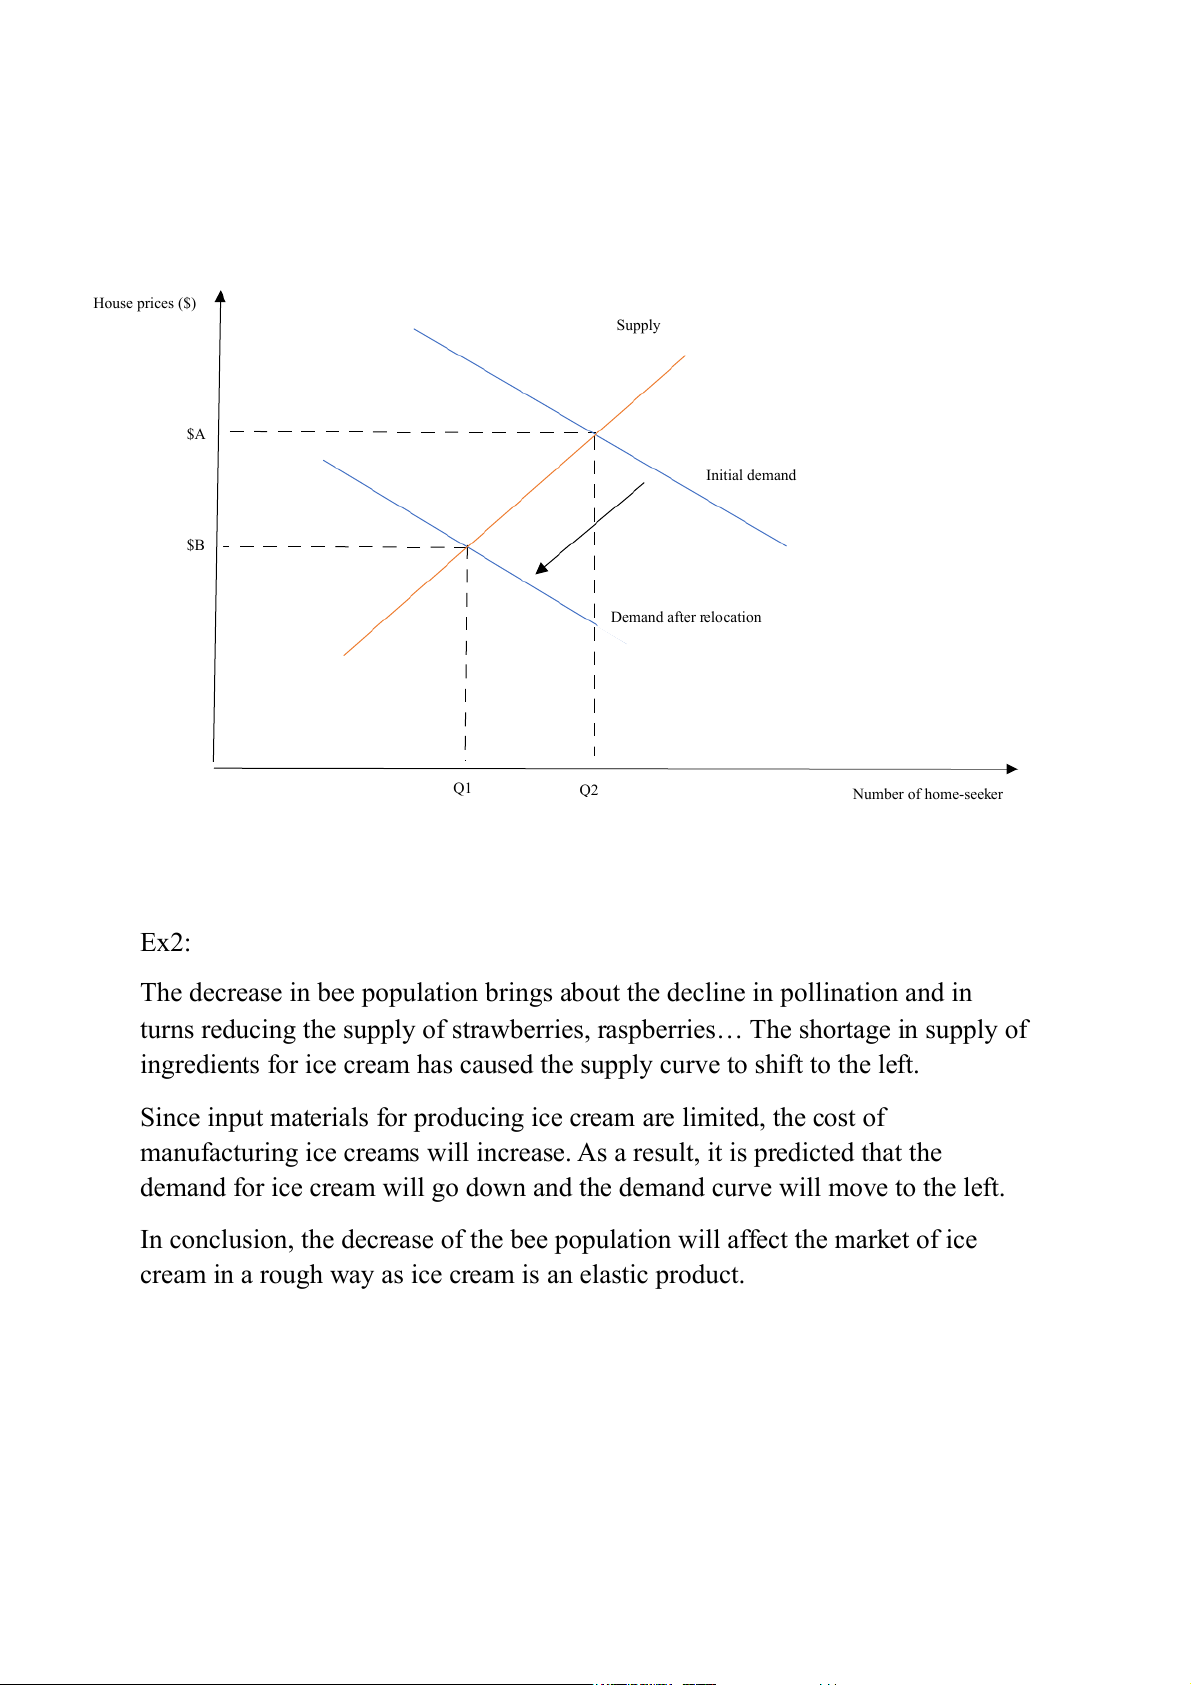
b. Half of the people who had relocated to Baton Rouge moved back to rebuilt
New Orleans means that the demand for house decreases. This led to an
excess supply, which caused the demand curve shift to the left and lowered
market price to meet equilibrium. House prices ($) Supply $A Initial demand $B Demand after relocation Q1 Q2 Number of home-seeker Ex2:
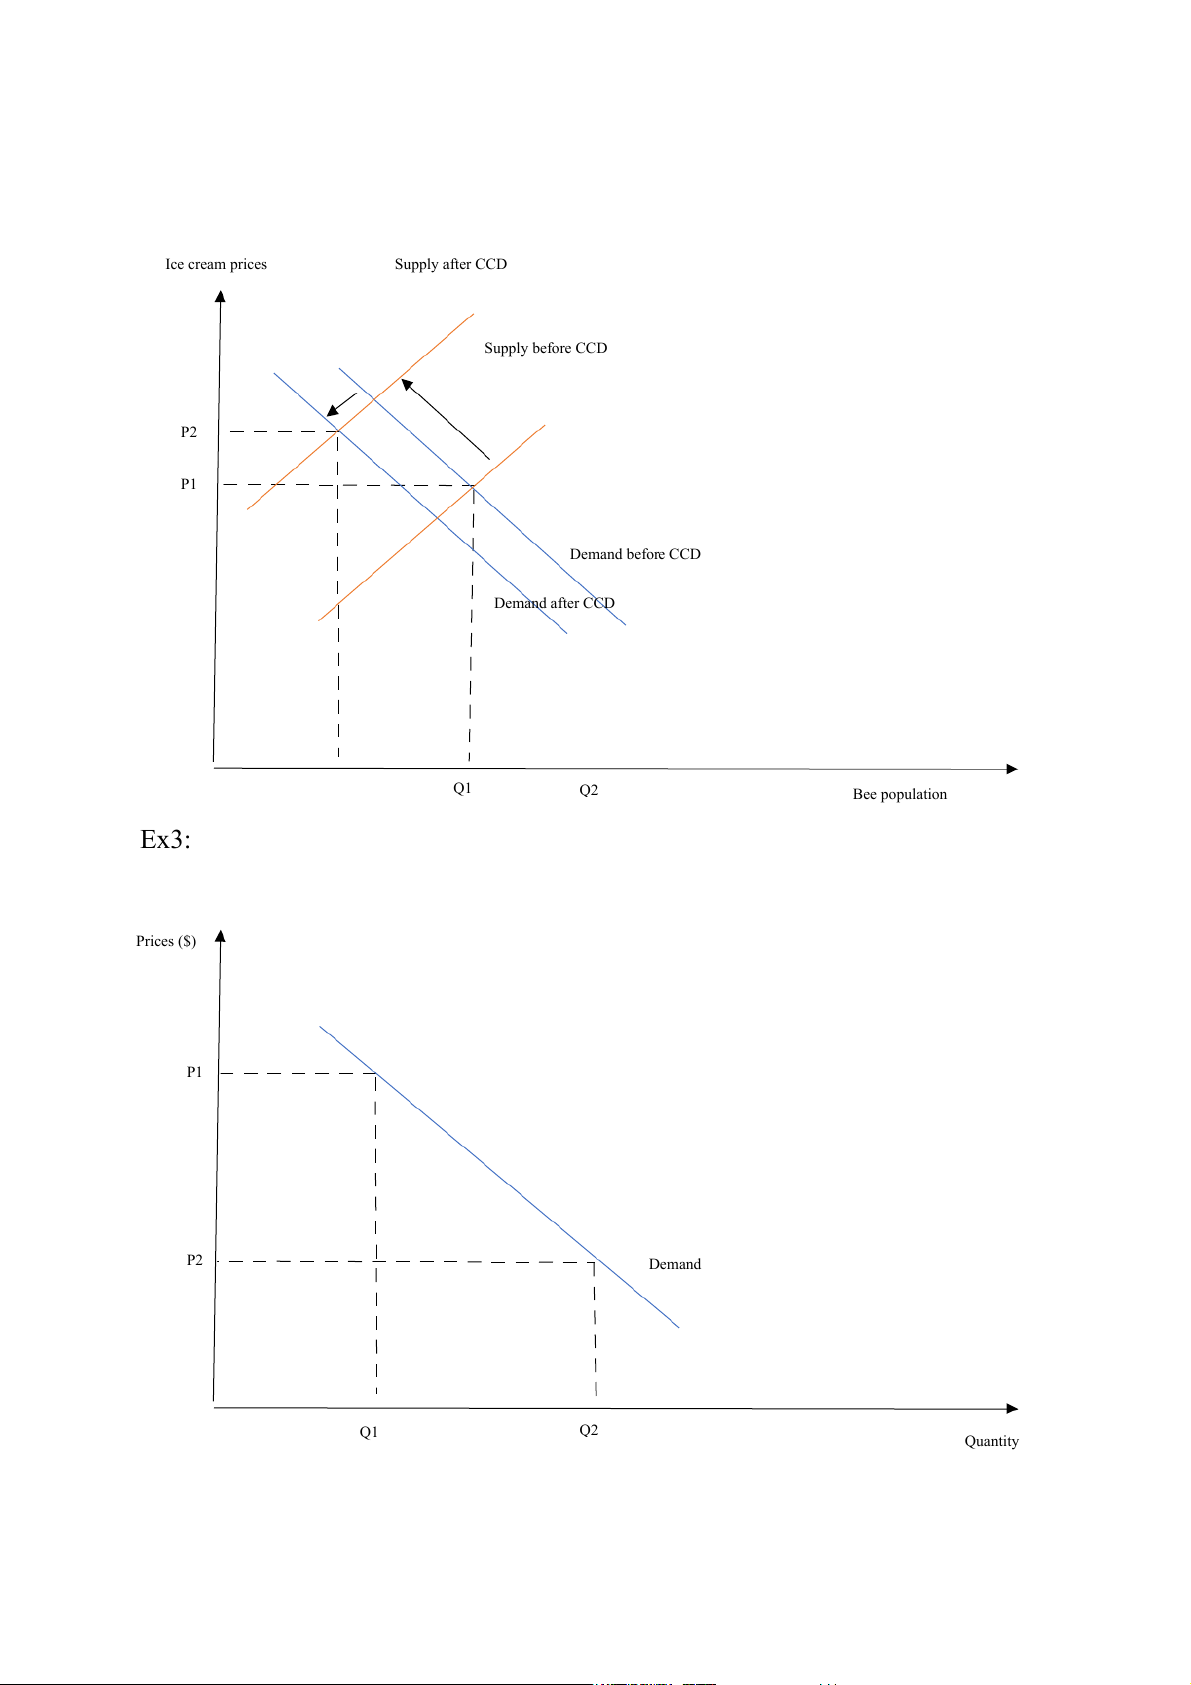
The decrease in bee population brings about the decline in pollination and in
turns reducing the supply of strawberries, raspberries… The shortage in supply of
ingredients for ice cream has caused the supply curve to shift to the left.
Since input materials for producing ice cream are limited, the cost of
manufacturing ice creams will increase. As a result, it is predicted that the
demand for ice cream will go down and the demand curve will move to the left.
In conclusion, the decrease of the bee population will affect the market of ice
cream in a rough way as ice cream is an elastic product. Ice cream prices Supply after CCD Supply before CCD P2 P1 Demand before CCD Demand after CCD Q1 Q2 Bee population Ex3: Prices ($) P1 P2 Demand Q1 Q2 Quantity a) We have
P1: $10/meal/person P2: $5/meal/person Q1: 2 meals Q2: 6 meals
->Total expenditure: $20 -> Total expenditure: $30
-> Elasticity of demand: E d
p = = = 4 ( ignore the minus sign) b)
- The promotional voucher has made a big impact on Mr. Binh family’s
monthly expenditure. By decreasing the cost of meals by 1%, the quantity
demanded rises by 4%, which increases total expenditure that Mr. Binh
spends on this restaurant by $10 ( from $20 to $30).
- The change in total expenditure will remain consistent with the value of
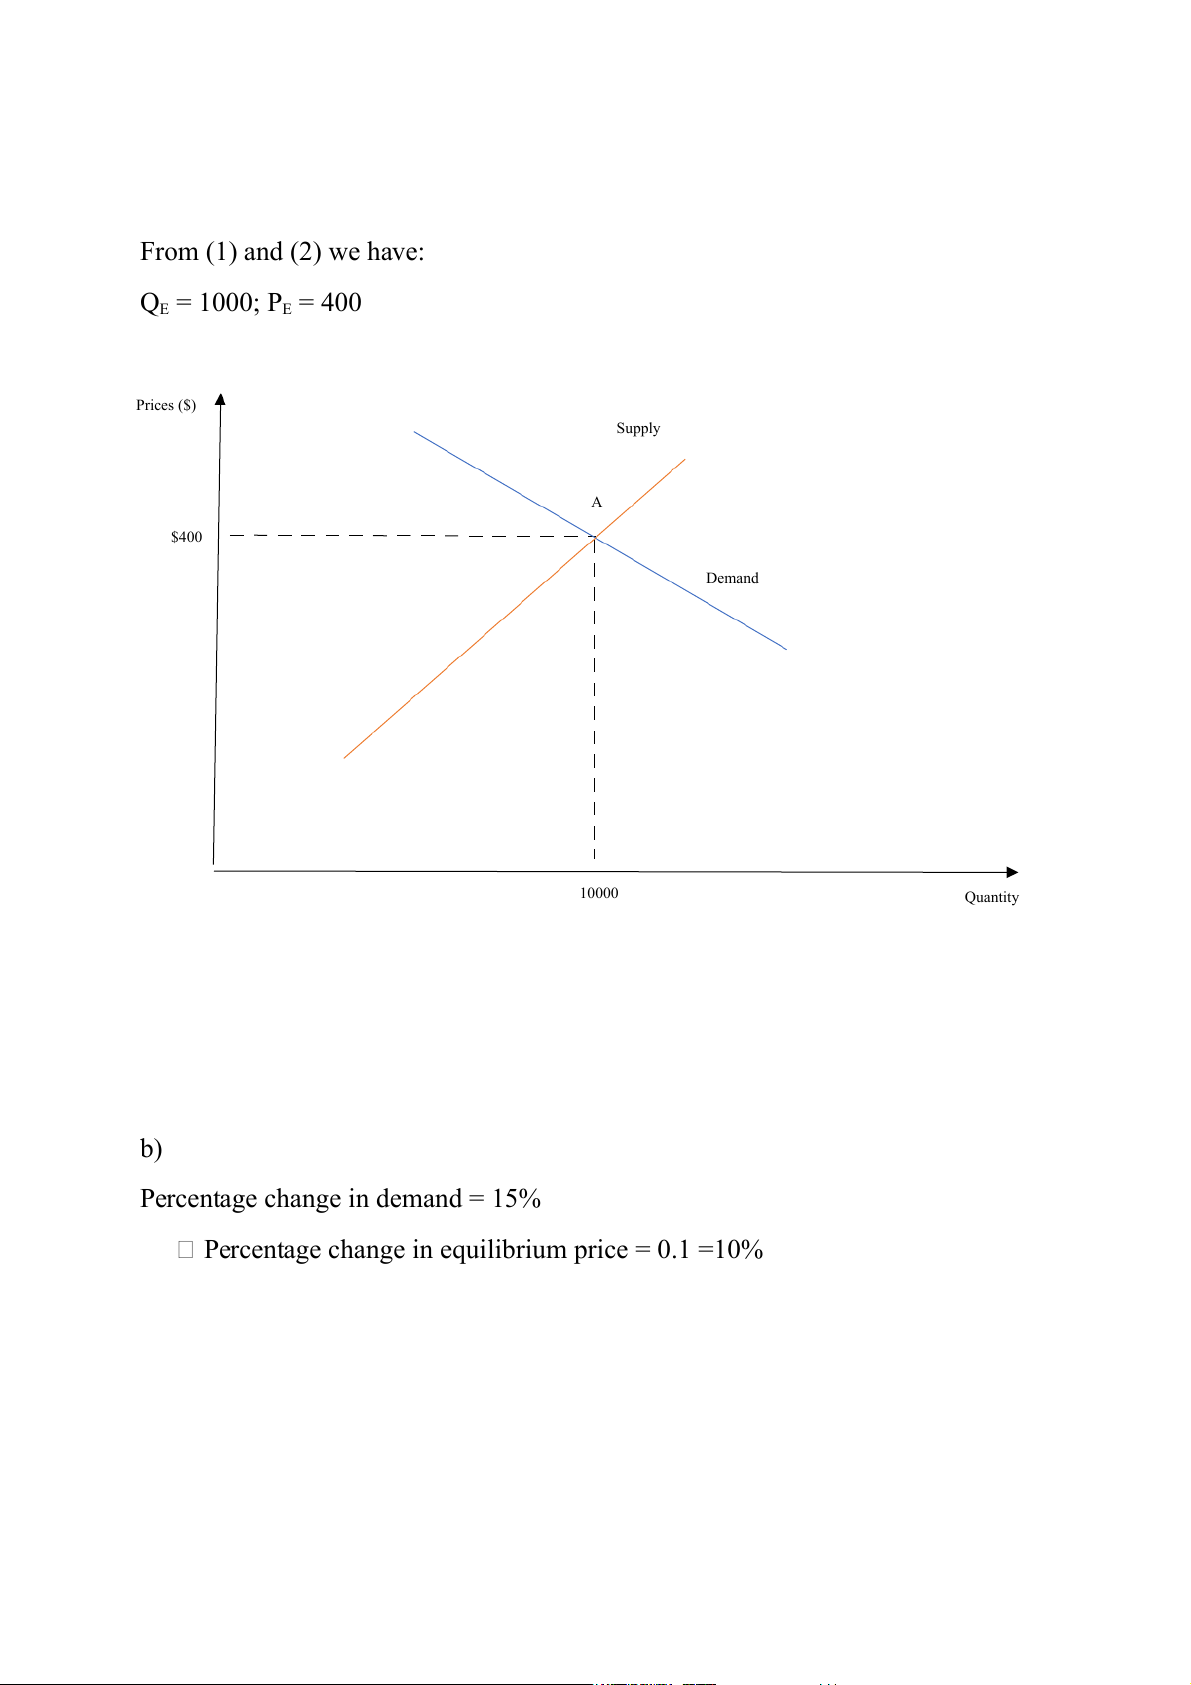
demand if all other factors are held constant (Ceteris paribus). Ex4: a) E d p = Q’p x = - x +) We have: E d p = 1; P= $400; Q= 1000 b = 0.4 (b>0) P = a - bQd a = 800 P = 800 – 0.4Qd (1) +) We have: E s p = 0.5; P= $400; Q= 1000 b = -0.8 (b<0) P = a – bQs a = -400 P = -400 + 0.8Qs (2) QE = QS = QP From (1) and (2) we have: QE = 1000; PE = 400 Prices ($) Supply A $400 Demand 10000 Quantity b)
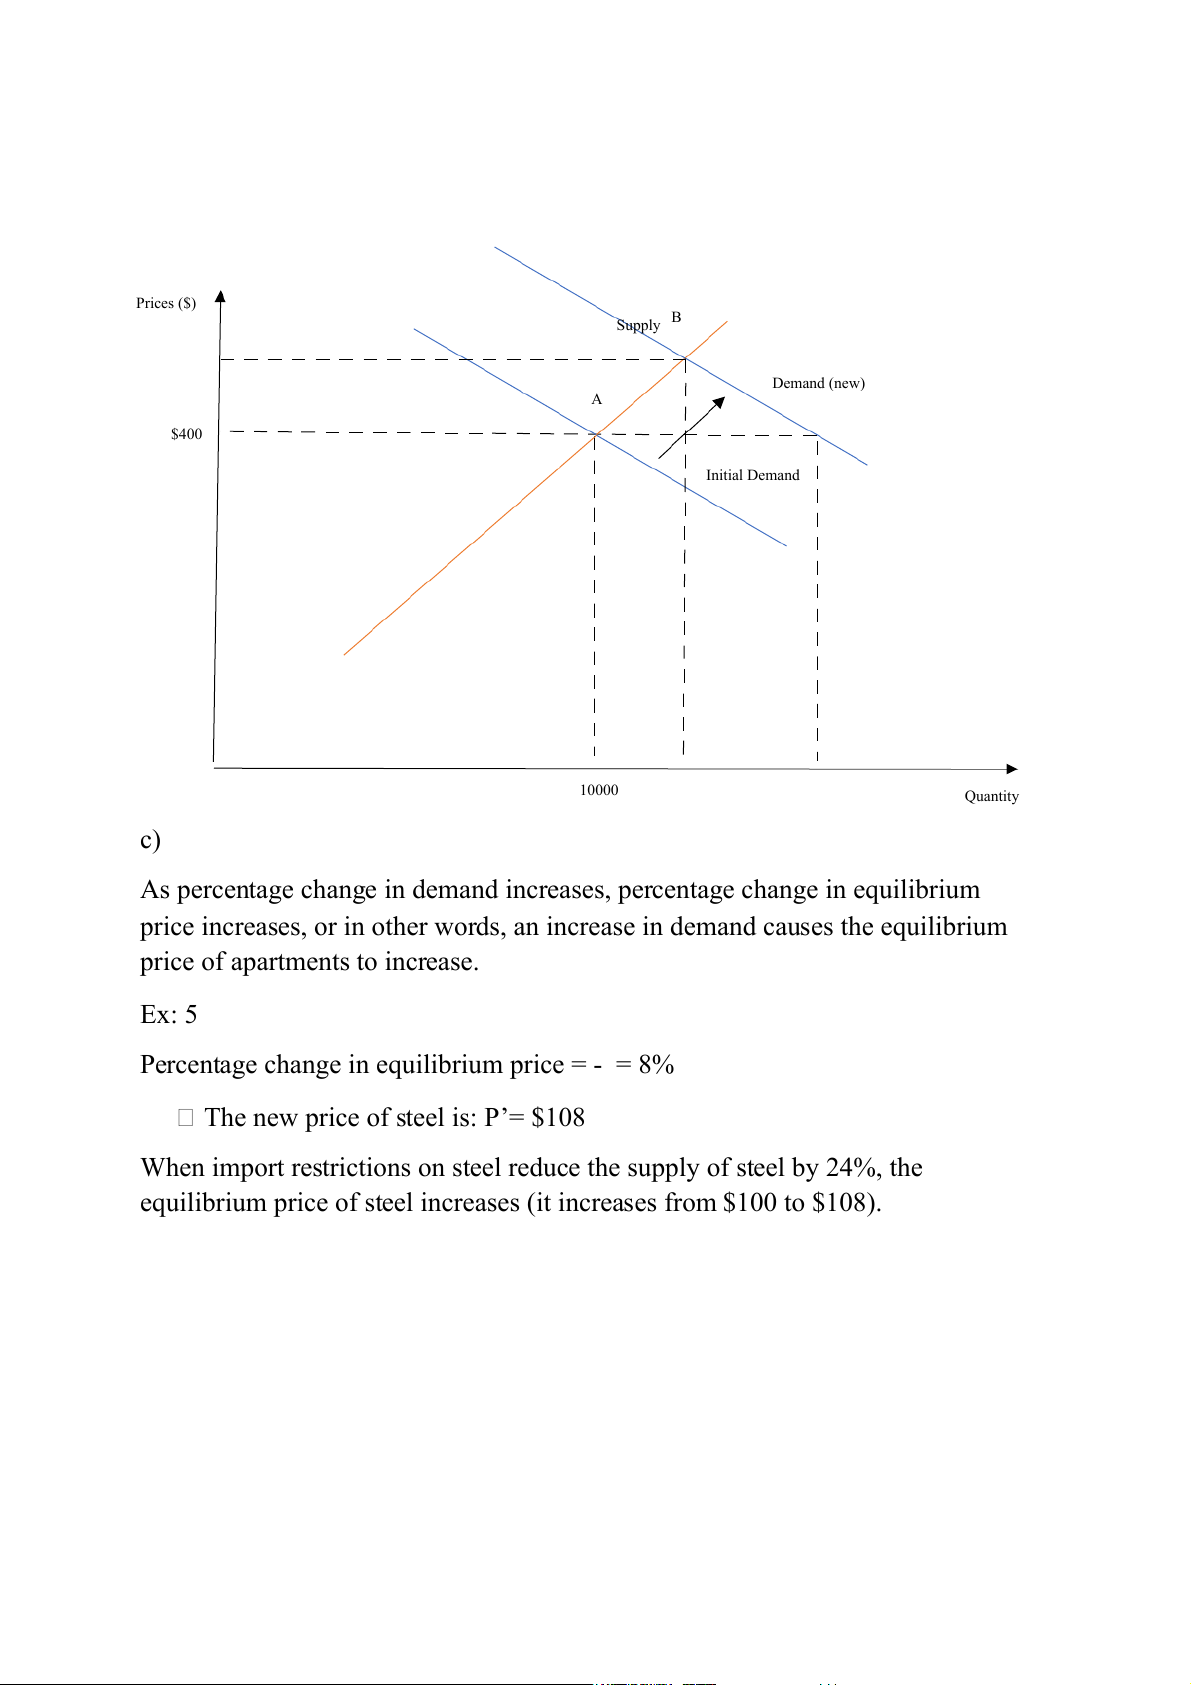
Percentage change in demand = 15%
Percentage change in equilibrium price = 0.1 =10% Prices ($) B Supply Demand (new) A $400 Initial Demand 10000 Quantity c)
As percentage change in demand increases, percentage change in equilibrium
price increases, or in other words, an increase in demand causes the equilibrium
price of apartments to increase. Ex: 5
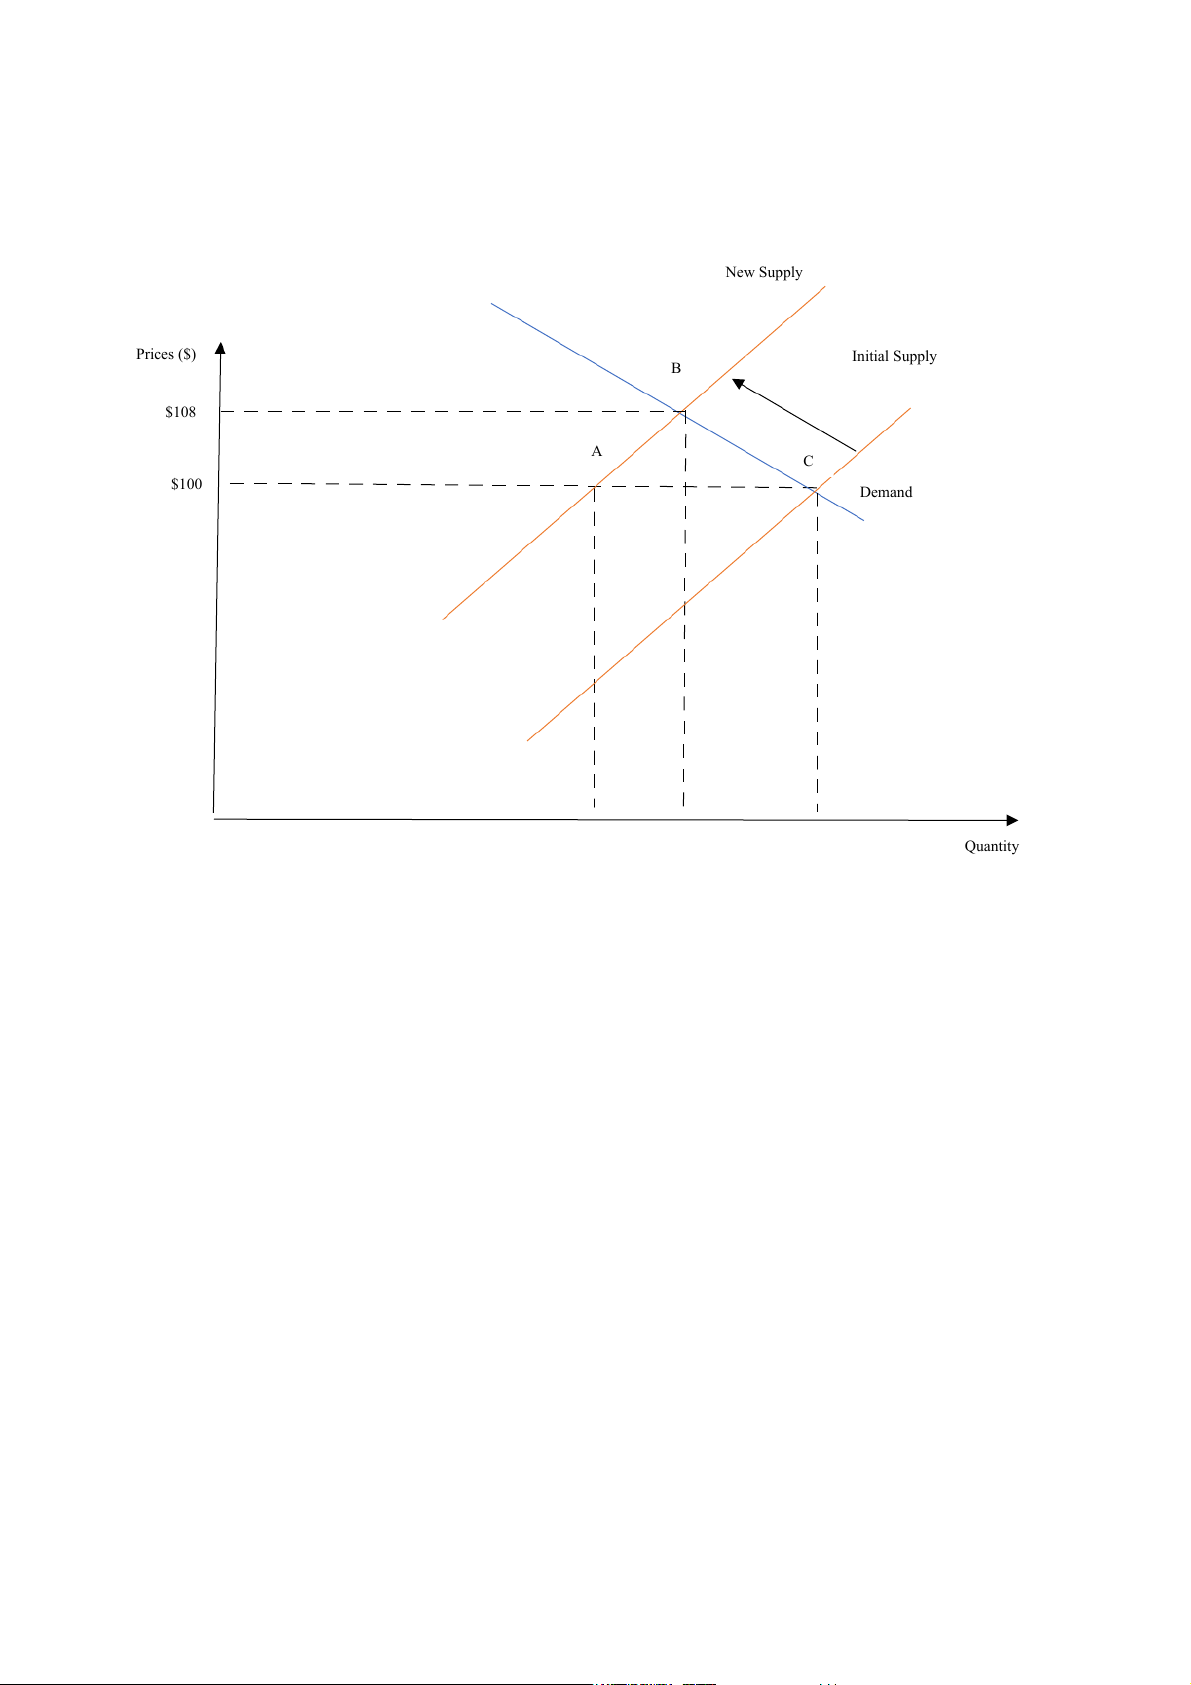
Percentage change in equilibrium price = - = 8%
The new price of steel is: P’= $108
When import restrictions on steel reduce the supply of steel by 24%, the
equilibrium price of steel increases (it increases from $100 to $108). New Supply Prices ($) Initial Supply B $108 A C $100 Demand Quantity
Tài liệu liên quan:
-

Chương 3: độ co giãn và các nhân tố ảnh hưởng | Microeconomics | Trường Đại học Quốc tế, Đại học Quốc gia Thành phố Hồ Chí Minh
3 2 -

Microeconomics Syllabus | Microeconomics | Trường Đại học Quốc tế, Đại học Quốc gia Thành phố Hồ Chí Minh
3 2 -

Microeconomics Course Syllabus & Assessment Details | Microeconomics | Trường Đại học Quốc tế, Đại học Quốc gia Thành phố Hồ Chí Minh
3 2 -

Assignment 3 - Elasticity MCQs and Key Concepts | Microeconomics | Trường Đại học Quốc tế, Đại học Quốc gia Thành phố Hồ Chí Minh
3 2 -

Assignment 2 - Economic Equilibrium Analysis of Fridges and Motorcycles | Microeconomics | Trường Đại học Quốc tế, Đại học Quốc gia Thành phố Hồ Chí Minh
3 2