Trade-offs and Opportunity Costs Principles | Microeconomics | Trường Đại học Quốc tế, Đại học Quốc gia Thành phố Hồ Chí Minh
Tài liệu được sưu tầm và soạn thảo dưới dạng file PDF với mục đích hỗ trợ học tập và tham khảo. Nội dung tài liệu được trình bày rõ ràng, dễ tiếp cận, phù hợp cho việc ôn tập và củng cố kiến thức trong quá trình học đại học. Đây sẽ là nguồn tư liệu hữu ích giúp các bạn sinh viên chuẩn bị tốt hơn cho các buổi học, đồng thời mở rộng thêm hiểu biết về môn học. Hy vọng tài liệu này sẽ mang lại nhiều giá trị và hỗ trợ các bạn trong hành trình học tập. Mời bạn đọc cùng tham khảo!
Môn: Microeconomics 635 tài liệu
Trường: Trường Đại học Quốc tế, Đại học Quốc gia Thành phố Hồ Chí Minh 1.9 K tài liệu
Tác giả:


Preview text:
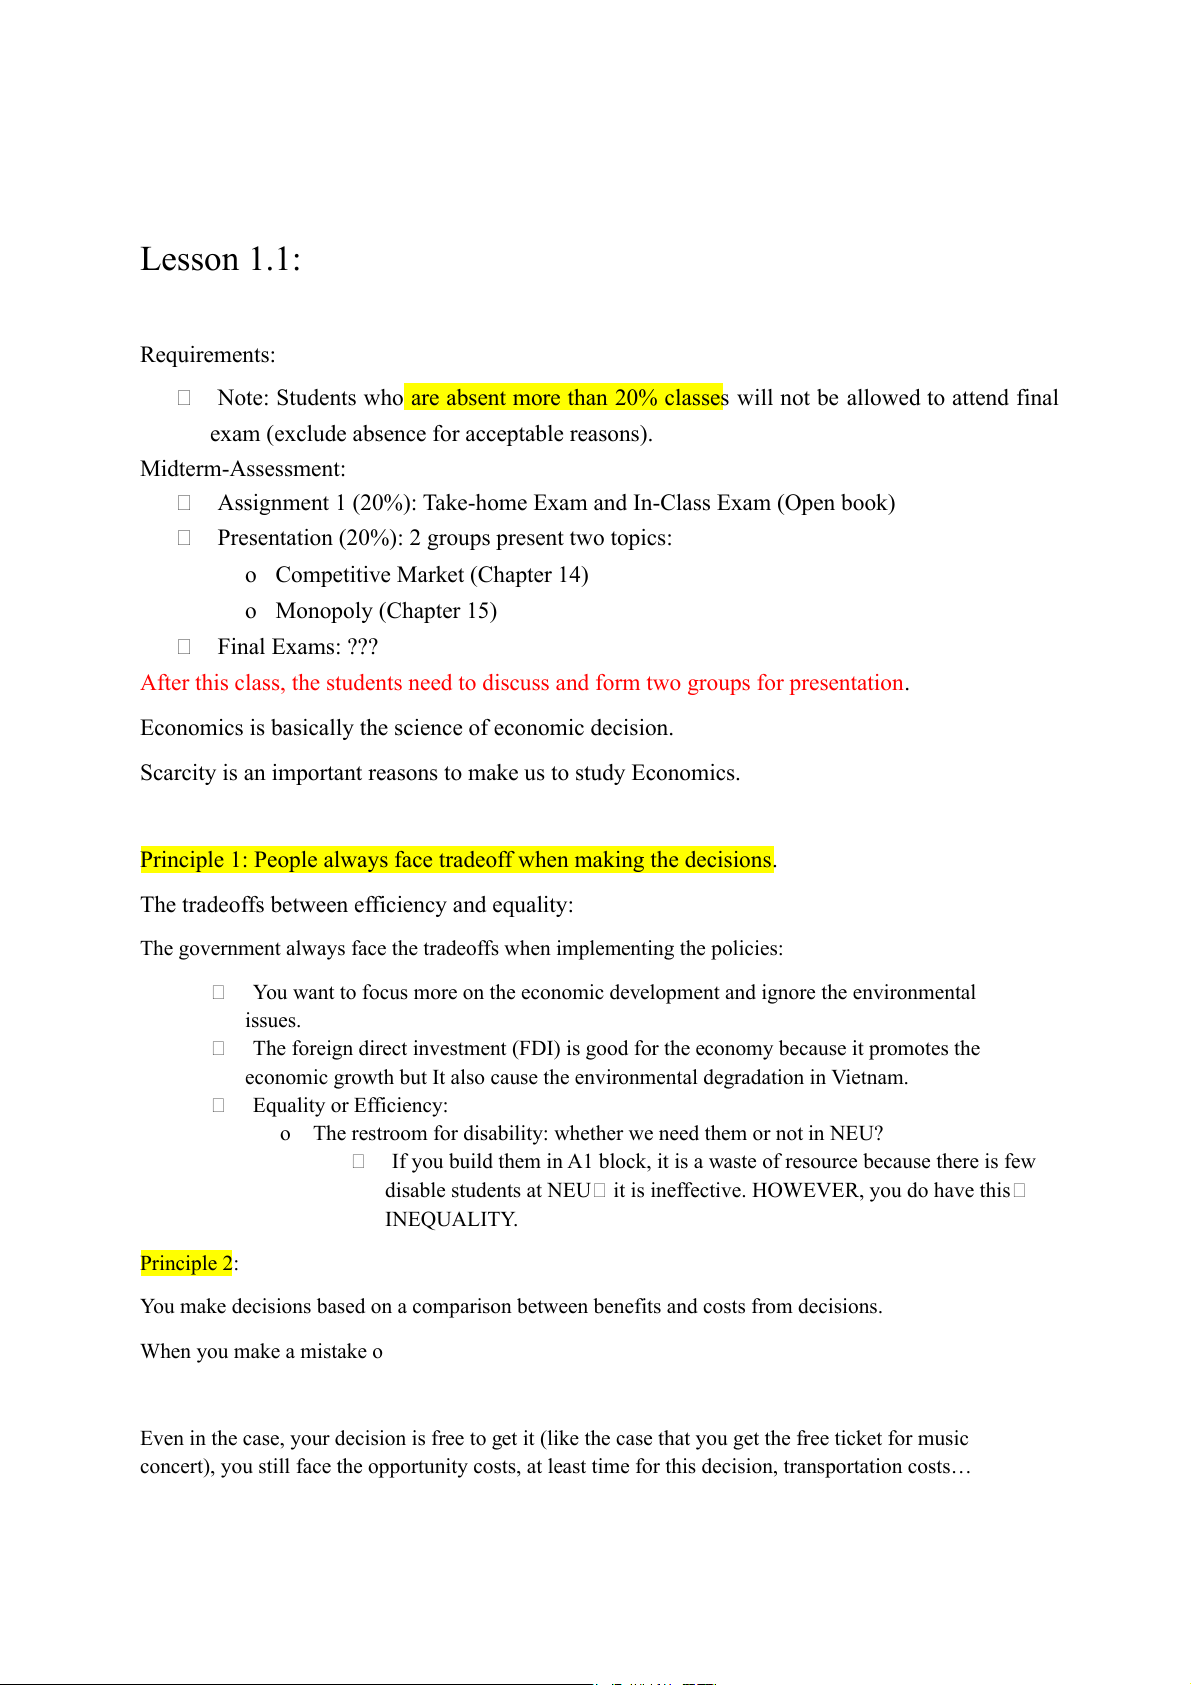
Lesson 1.1: Requirements:
Note: Students who are absent more than 20% classes will not be allowed to attend final
exam (exclude absence for acceptable reasons). Midterm-Assessment:
Assignment 1 (20%): Take-home Exam and In-Class Exam (Open book)
Presentation (20%): 2 groups present two topics:
o Competitive Market (Chapter 14) o Monopoly (Chapter 15) Final Exams: ???
After this class, the students need to discuss and form two groups for presentation.
Economics is basically the science of economic decision.
Scarcity is an important reasons to make us to study Economics.
Principle 1: People always face tradeoff when making the decisions.
The tradeoffs between efficiency and equality:
The government always face the tradeoffs when implementing the policies:
You want to focus more on the economic development and ignore the environmental issues.
The foreign direct investment (FDI) is good for the economy because it promotes the
economic growth but It also cause the environmental degradation in Vietnam. Equality or Efficiency:
o The restroom for disability: whether we need them or not in NEU?
If you build them in A1 block, it is a waste of resource because there is few
disable students at NEU it is ineffective. HOWEVER, you do have this INEQUALITY. Principle 2:
You make decisions based on a comparison between benefits and costs from decisions. When you make a mistake o
Even in the case, your decision is free to get it (like the case that you get the free ticket for music
concert), you still face the opportunity costs, at least time for this decision, transportation costs…
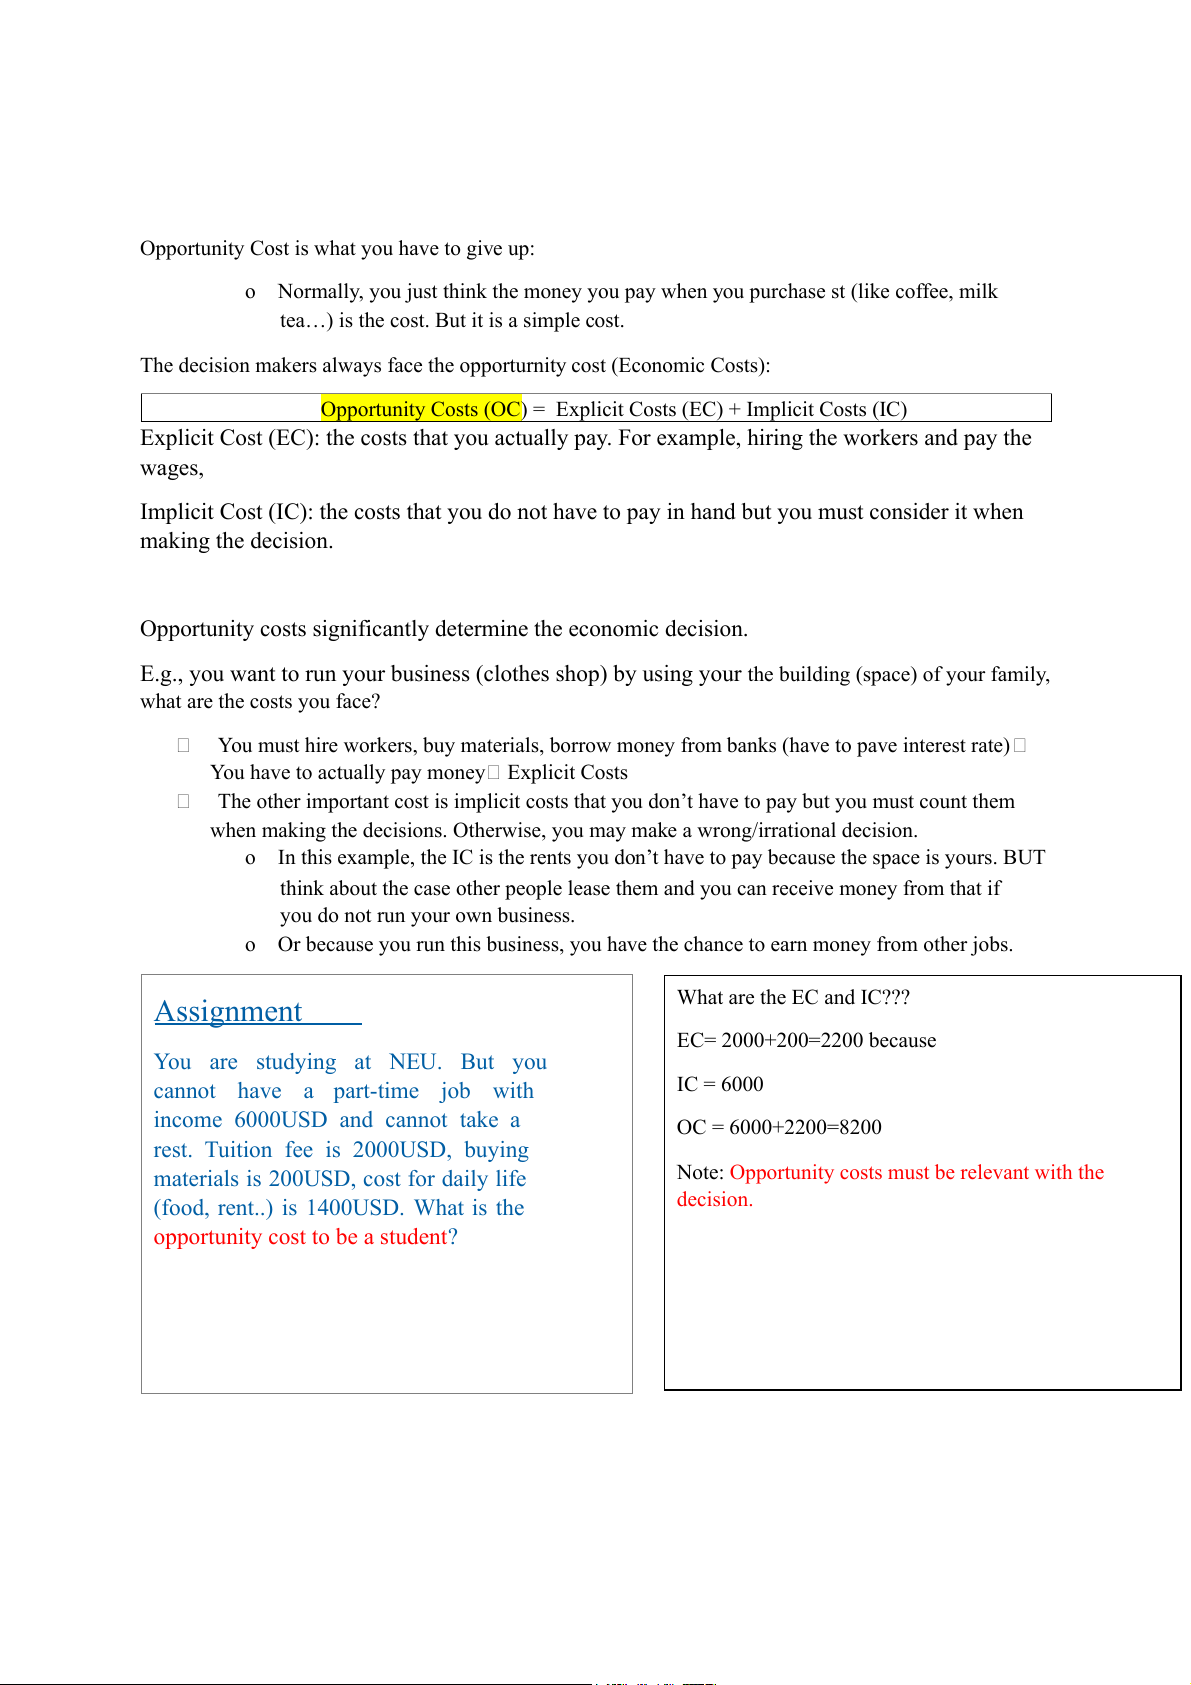
Opportunity Cost is what you have to give up:
o Normally, you just think the money you pay when you purchase st (like coffee, milk
tea…) is the cost. But it is a simple cost.
The decision makers always face the opporturnity cost (Economic Costs):
Opportunity Costs (OC) = Explicit Costs (EC) + Implicit Costs (IC)
Explicit Cost (EC): the costs that you actually pay. For example, hiring the workers and pay the wages,
Implicit Cost (IC): the costs that you do not have to pay in hand but you must consider it when making the decision.
Opportunity costs significantly determine the economic decision.
E.g., you want to run your business (clothes shop) by using your the building (space) of your family, what are the costs you face?
You must hire workers, buy materials, borrow money from banks (have to pave interest rate)
You have to actually pay money Explicit Costs
The other important cost is implicit costs that you don’t have to pay but you must count them
when making the decisions. Otherwise, you may make a wrong/irrational decision.
o In this example, the IC is the rents you don’t have to pay because the space is yours. BUT
think about the case other people lease them and you can receive money from that if
you do not run your own business.
o Or because you run this business, you have the chance to earn money from other jobs. Assignment What are the EC and IC??? EC= 2000+200=2200 because
You are studying at NEU. But you
cannot have a part-time job with IC = 6000
income 6000USD and cannot take a OC = 6000+2200=8200
rest. Tuition fee is 2000USD, buying
materials is 200USD, cost for daily life
Note: Opportunity costs must be relevant with the
(food, rent..) is 1400USD. What is the decision.
opportunity cost to be a student?
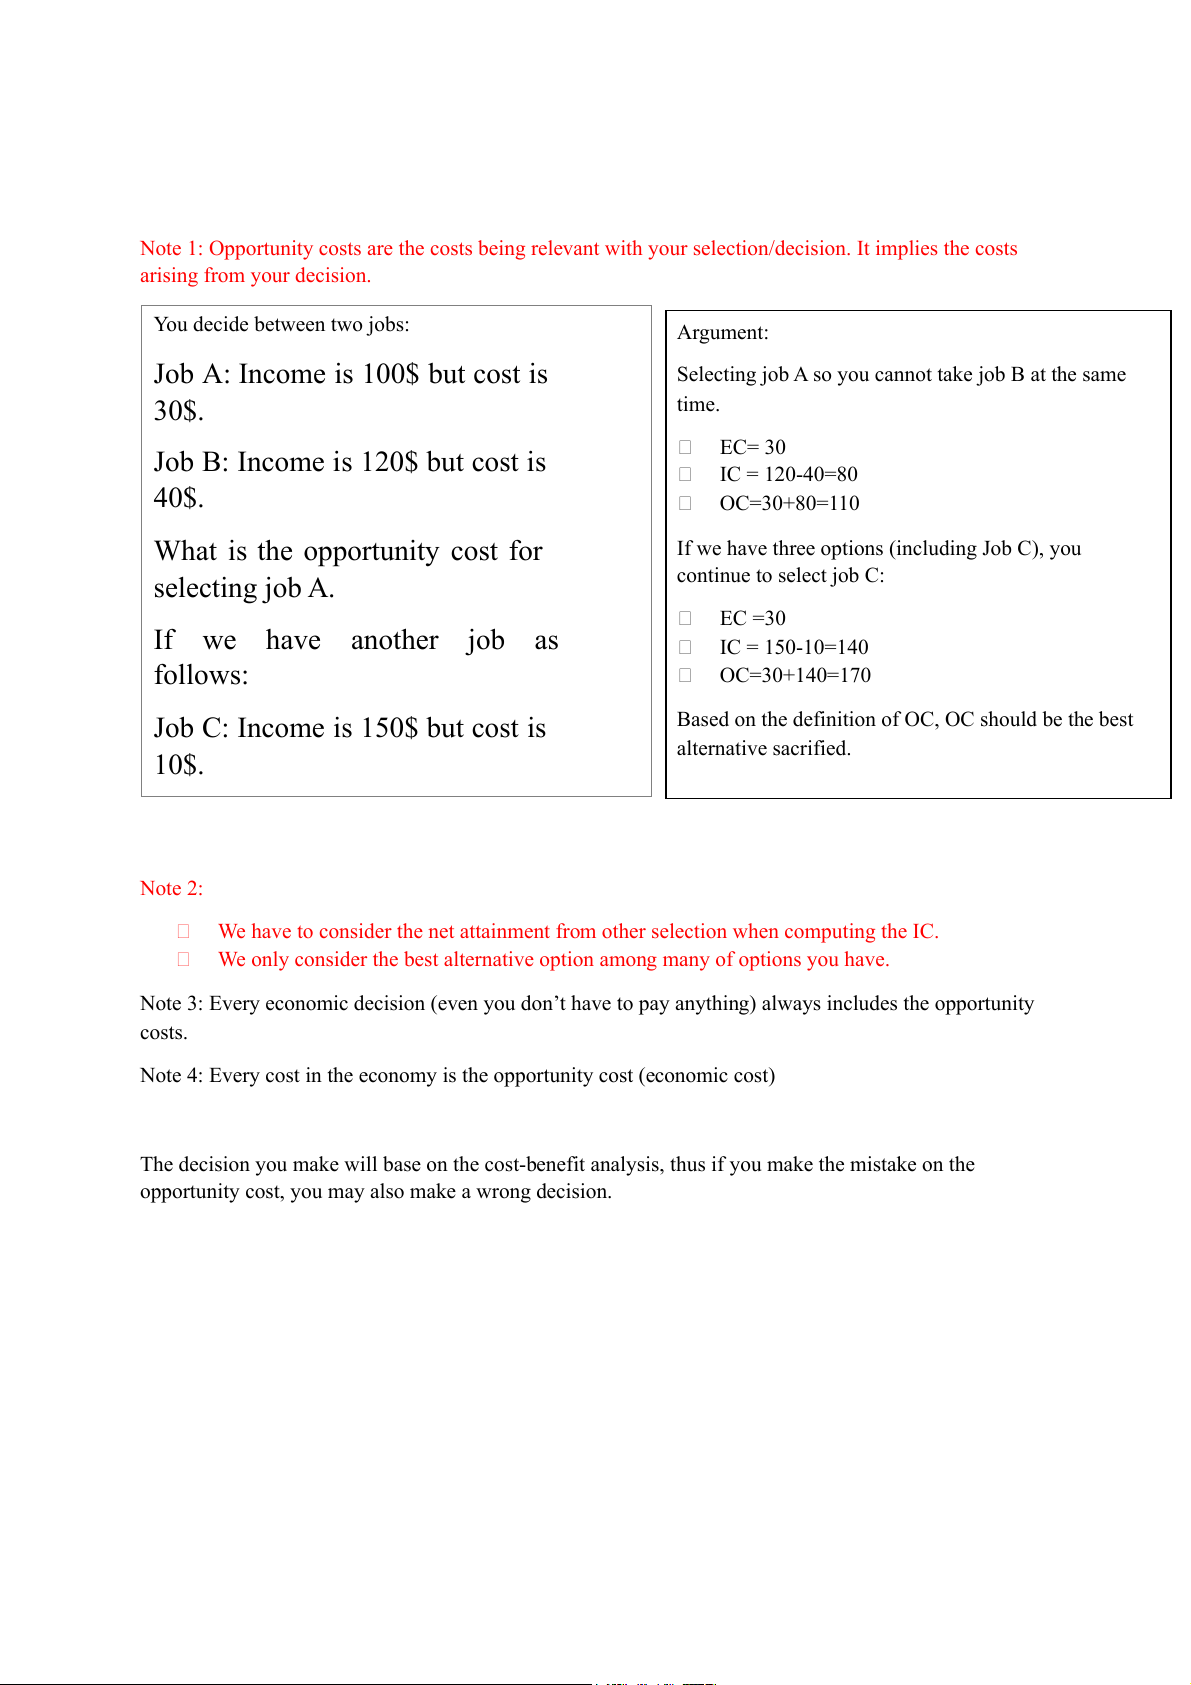
Note 1: Opportunity costs are the costs being relevant with your selection/decision. It implies the costs arising from your decision. You decide between two jobs: Argument:
Job A: Income is 100$ but cost is
Selecting job A so you cannot take job B at the same 30$. time.
Job B: Income is 120$ but cost is EC= 30 IC = 120-40=80 40$. OC=30+80=110
What is the opportunity cost for
If we have three options (including Job C), you selecting job A. continue to select job C: EC =30 If we have another job as IC = 150-10=140 follows: OC=30+140=170
Job C: Income is 150$ but cost is
Based on the definition of OC, OC should be the best alternative sacrified. 10$. Note 2:
We have to consider the net attainment from other selection when computing the IC.
We only consider the best alternative option among many of options you have.
Note 3: Every economic decision (even you don’t have to pay anything) always includes the opportunity costs.
Note 4: Every cost in the economy is the opportunity cost (economic cost)
The decision you make will base on the cost-benefit analysis, thus if you make the mistake on the
opportunity cost, you may also make a wrong decision.
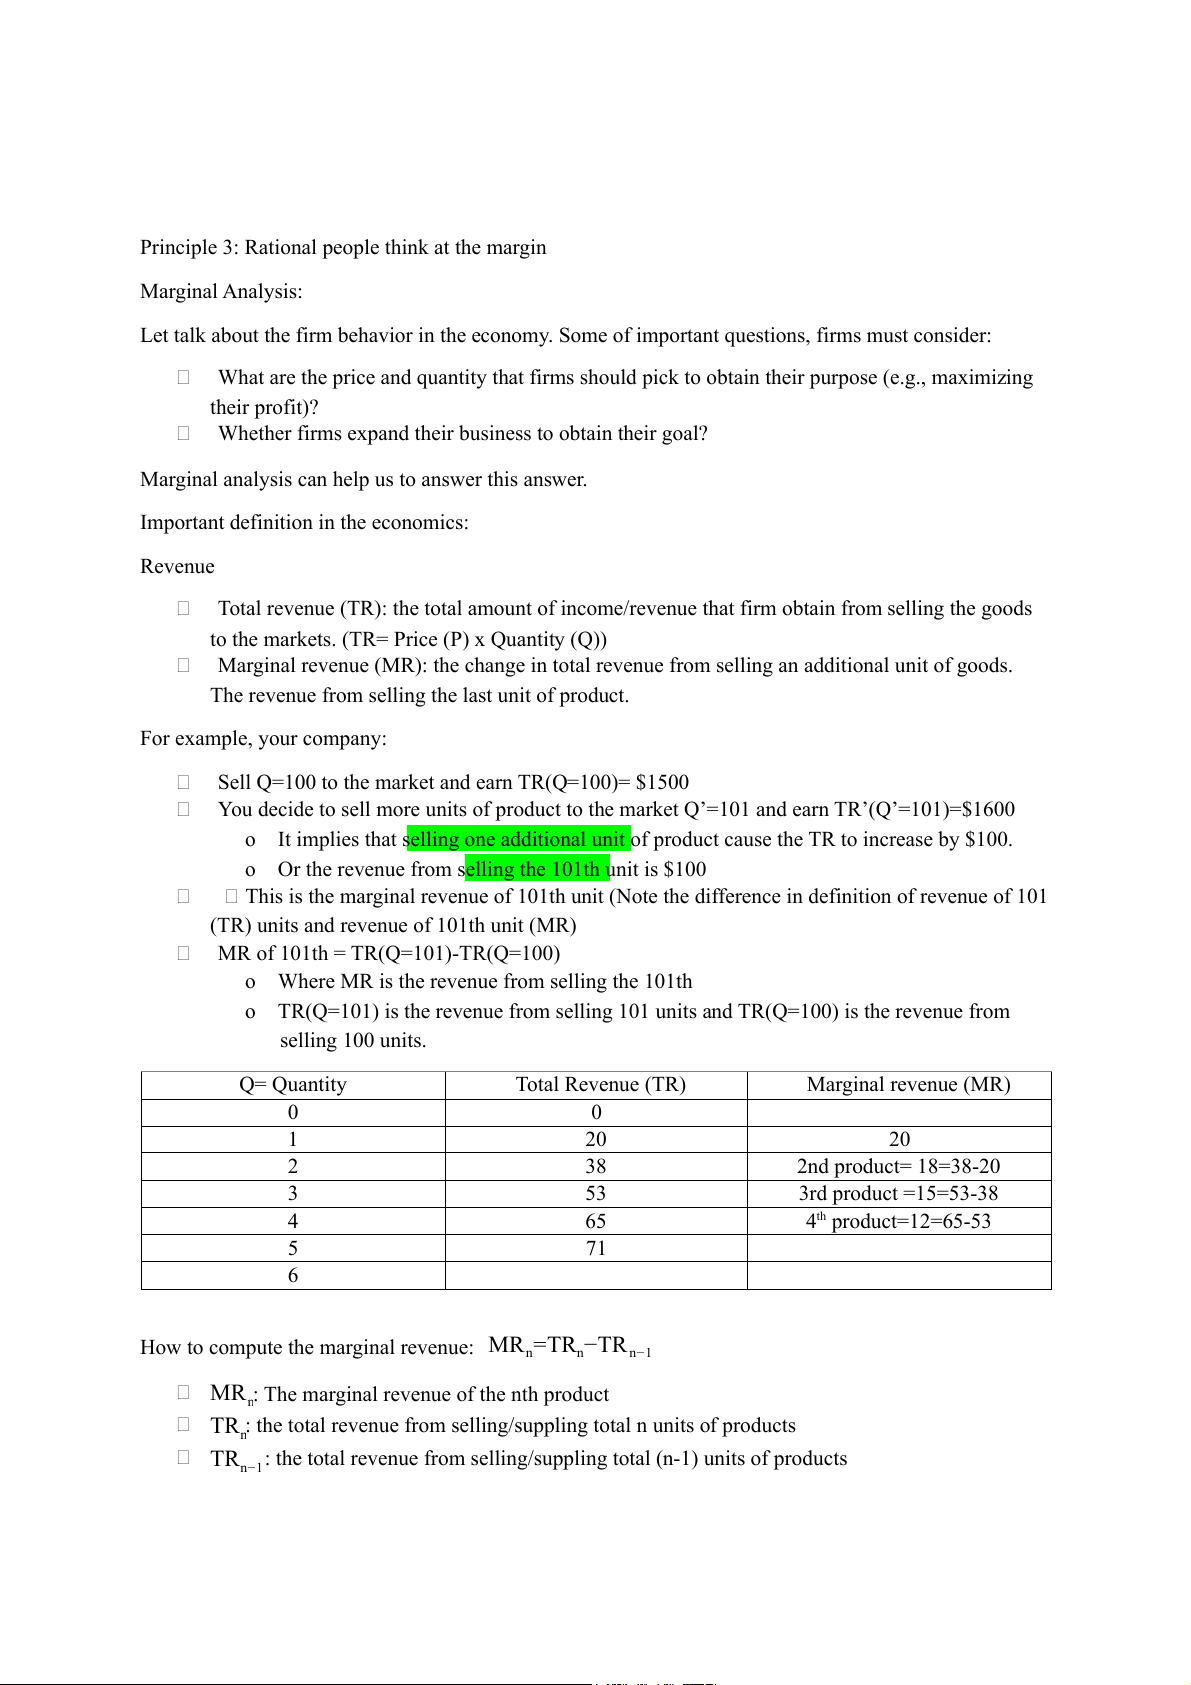
Principle 3: Rational people think at the margin Marginal Analysis:
Let talk about the firm behavior in the economy. Some of important questions, firms must consider:
What are the price and quantity that firms should pick to obtain their purpose (e.g., maximizing their profit)?
Whether firms expand their business to obtain their goal?
Marginal analysis can help us to answer this answer.
Important definition in the economics: Revenue
Total revenue (TR): the total amount of income/revenue that firm obtain from selling the goods
to the markets. (TR= Price (P) x Quantity (Q))
Marginal revenue (MR): the change in total revenue from selling an additional unit of goods.
The revenue from selling the last unit of product. For example, your company:
Sell Q=100 to the market and earn TR(Q=100)= $1500
You decide to sell more units of product to the market Q’=101 and earn TR’(Q’=101)=$1600
o It implies that selling one additional unit of product cause the TR to increase by $100.
o Or the revenue from selling the 101th unit is $100
This is the marginal revenue of 101th unit (Note the difference in definition of revenue of 101
(TR) units and revenue of 101th unit (MR)
MR of 101th = TR(Q=101)-TR(Q=100)
o Where MR is the revenue from selling the 101th
o TR(Q=101) is the revenue from selling 101 units and TR(Q=100) is the revenue from selling 100 units. Q= Quantity Total Revenue (TR) Marginal revenue (MR) 0 0 1 20 20 2 38 2nd product= 18=38-20 3 53 3rd product =15=53-38 4 65 4th product=12=65-53 5 71 6
How to compute the marginal revenue: MR =TR −TR n n n−1
MR : The marginal revenue of the nth product n
TR : the total revenue from selling/suppling total n units of products n
TR : the total revenue from selling/suppling total (n-1) units of products n−1 ∆ TR ∂TR
Based on the definition, you also compute the MR as follows: MR= = =TR' (Q ∆Q ∂ Q
Note:∆ means a large amount of change and ∂ means a small amount of change. If the change occurs by
a very small amount, MR=TR’(Q) (the first derivative of total revenue against Q). For example,
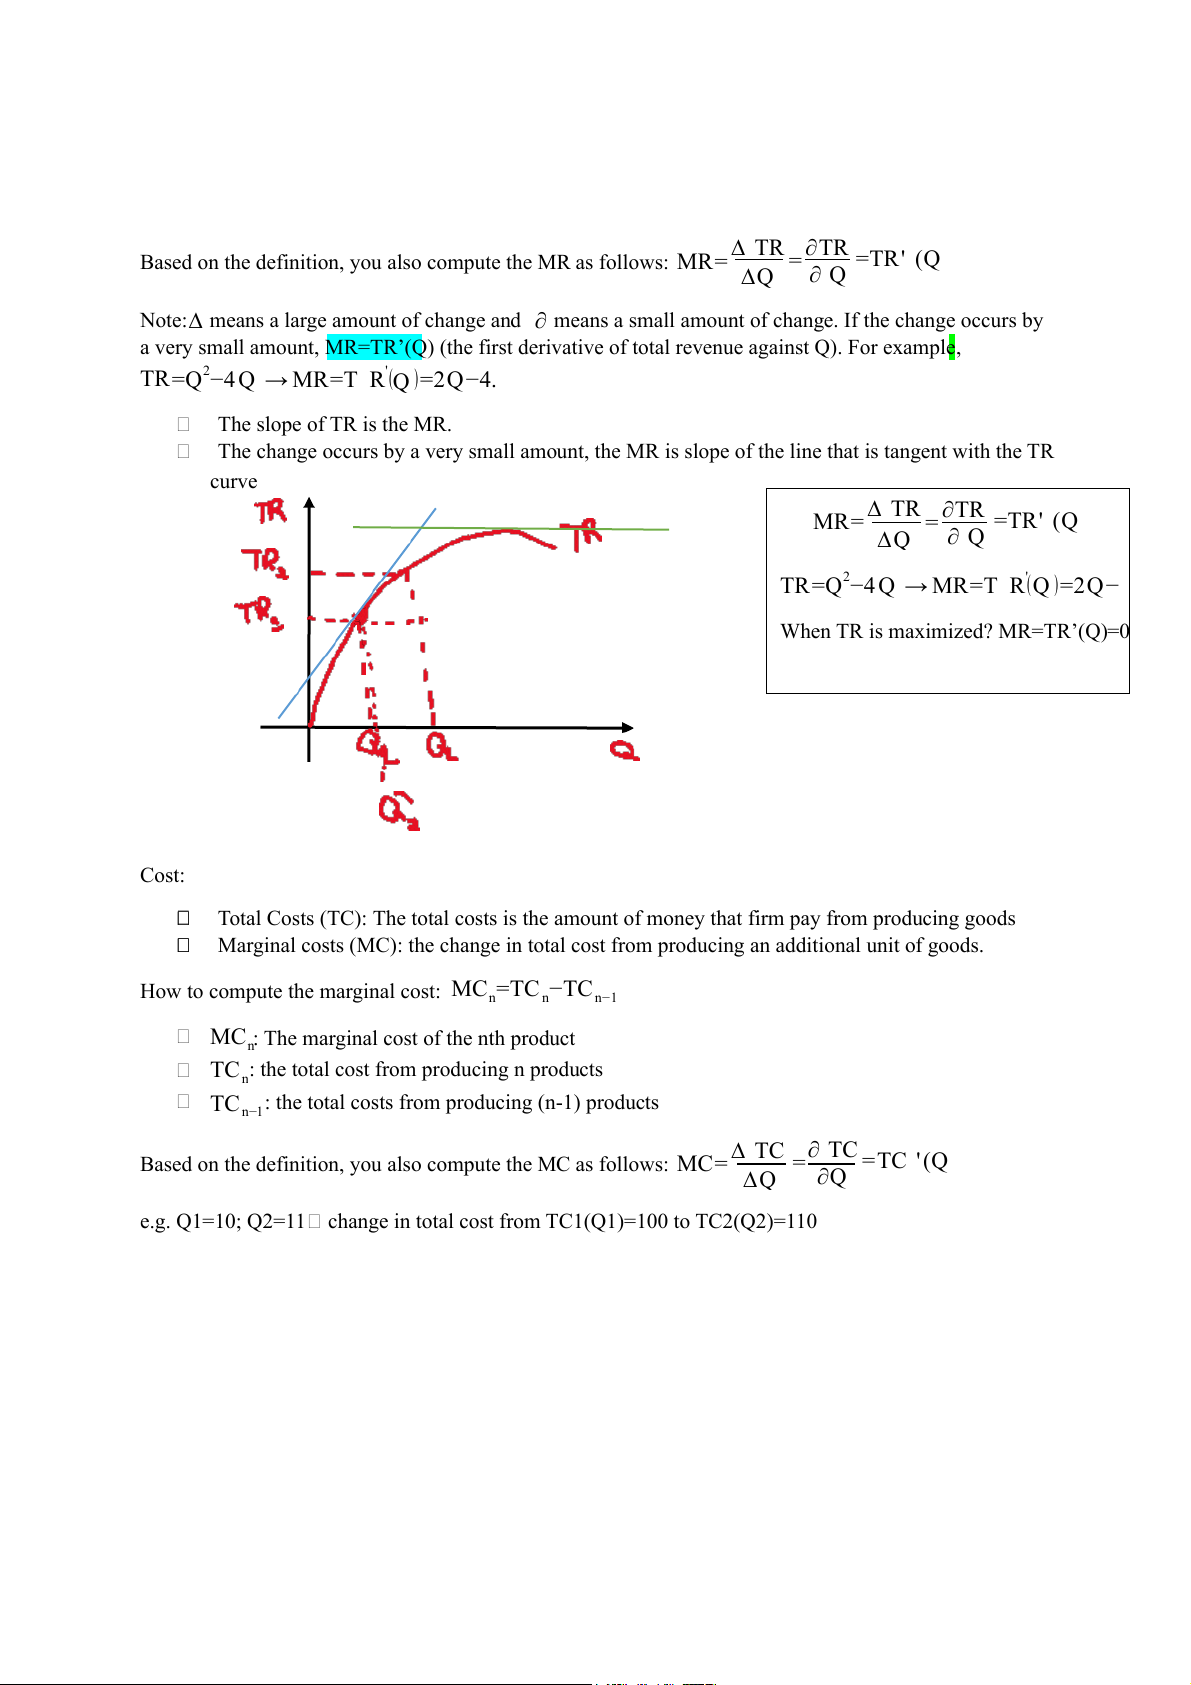
TR=Q2−4 Q → MR=T R'(Q )=2Q−4. The slope of TR is the MR.
The change occurs by a very small amount, the MR is slope of the line that is tangent with the TR curve ∆ TR MR= ∂TR = =TR' (Q ∆Q ∂ Q
TR=Q2−4 Q → MR=T R'(Q )=2Q−
When TR is maximized? MR=TR’(Q)=0 Cost:
Total Costs (TC): The total costs is the amount of money that firm pay from producing goods
Marginal costs (MC): the change in total cost from producing an additional unit of goods.
How to compute the marginal cost: MC =TC −TC n n n−1
MC : The marginal cost of the nth product n
TC : the total cost from producing n products n
TC : the total costs from producing (n-1) products n−1 ∆ TC ∂ TC
Based on the definition, you also compute the MC as follows: MC= = =TC '(Q ∆Q ∂Q
e.g. Q1=10; Q2=11 change in total cost from TC1(Q1)=100 to TC2(Q2)=110
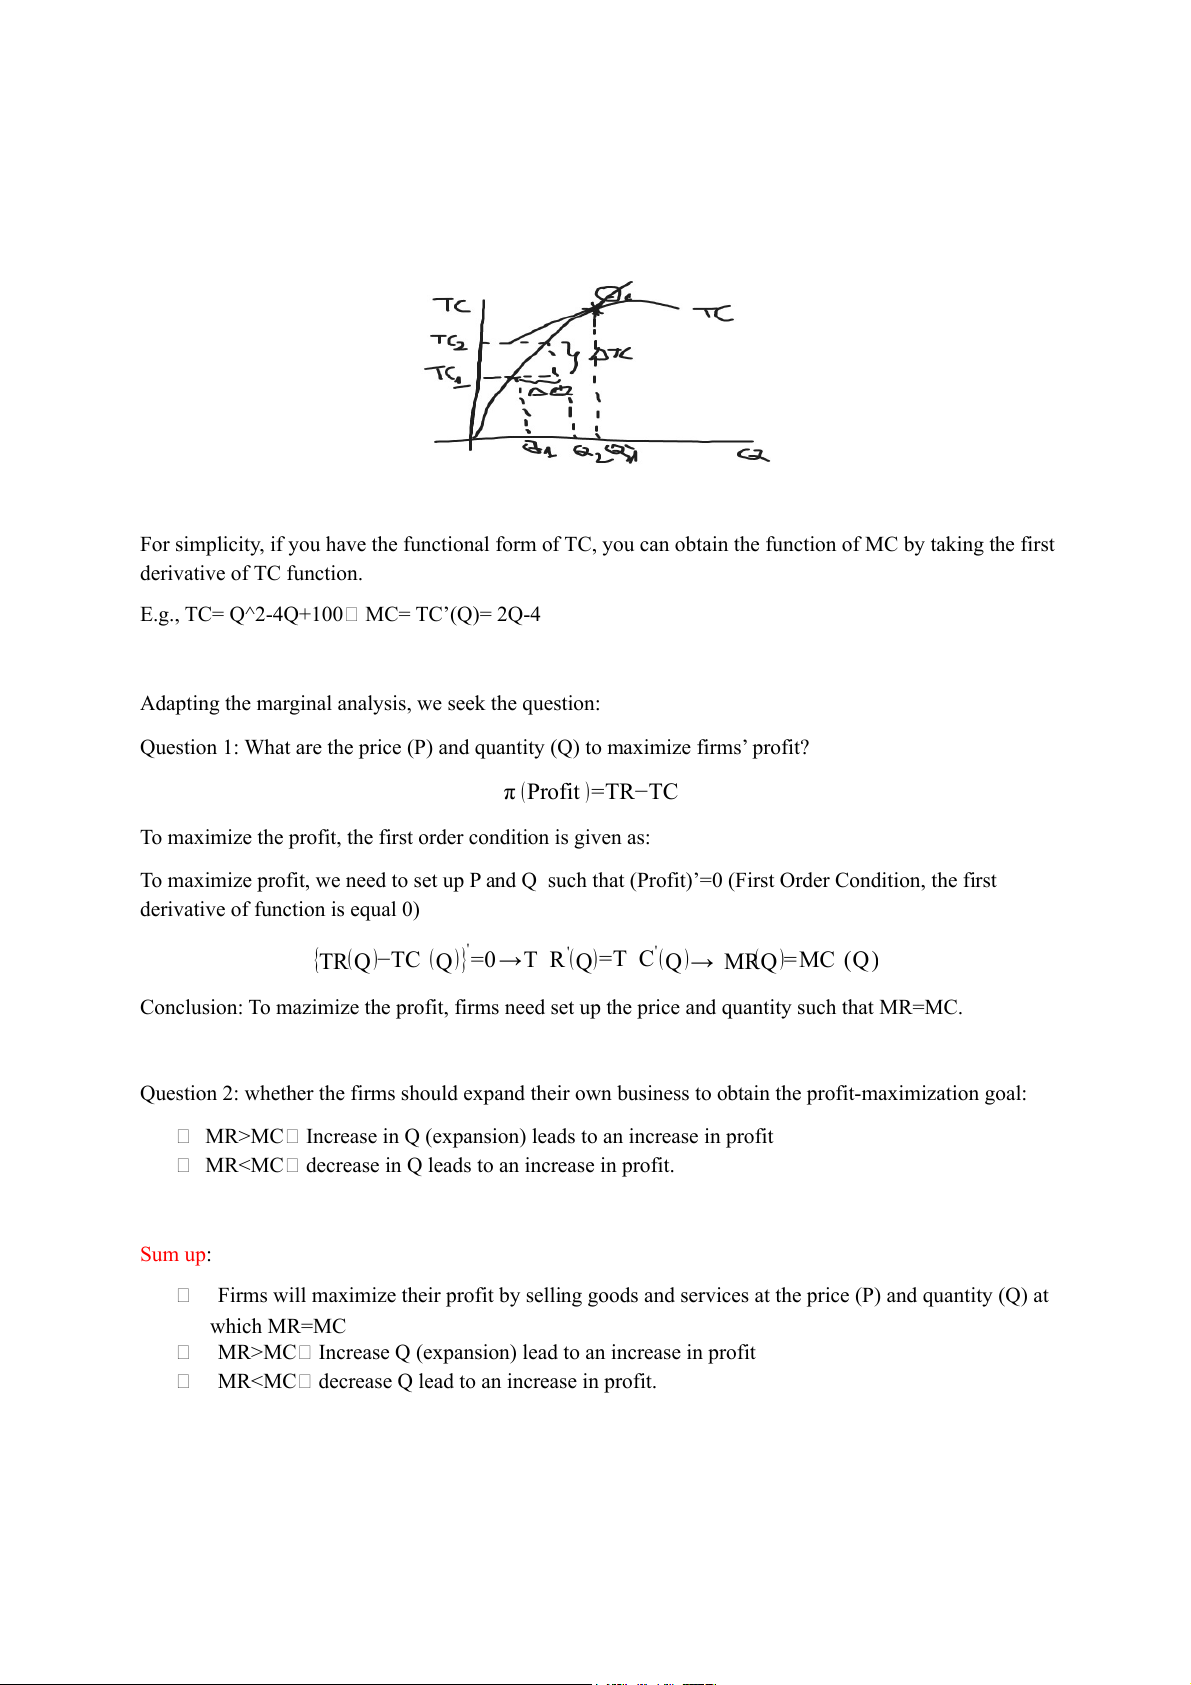
For simplicity, if you have the functional form of TC, you can obtain the function of MC by taking the first derivative of TC function.
E.g., TC= Q^2-4Q+100 MC= TC’(Q)= 2Q-4
Adapting the marginal analysis, we seek the question:
Question 1: What are the price (P) and quantity (Q) to maximize firms’ profit? π (Profit )=TR−TC
To maximize the profit, the first order condition is given as:
To maximize profit, we need to set up P and Q such that (Profit)’=0 (First Order Condition, the first
derivative of function is equal 0)
{TR(Q)−TC (Q)}'=0→T R'(Q)=T C'(Q)→ MR(Q)=MC (Q)
Conclusion: To mazimize the profit, firms need set up the price and quantity such that MR=MC.
Question 2: whether the firms should expand their own business to obtain the profit-maximization goal:
MR>MC Increase in Q (expansion) leads to an increase in profit MRSum up:
Firms will maximize their profit by selling goods and services at the price (P) and quantity (Q) at which MR=MC
MR>MC Increase Q (expansion) lead to an increase in profit
MRMarginal Analysis for general problem Member Households Firms Government Purposes Maximize their utility Maximize their profit Maximize the social (Satisfaction) utility
The utility, profit, social utility can be defined as Net Benefit (NB) where NB=TB-TC
TB: Total Benefit (this is TR when we study the behavior of firms) MB=TB’(Q)
TC: Total Cost (this is TC when we study the behavior of firms) MC = TC’(Q)
All members/agents of economy wish to maximize their own net benefit. They can achieve this goal
by setting price (P) and quantity (Q) such that: MB=MC NB is maximized
MB>MC increase in Q will lead to an increase in NB MBExercise
Total Benefit (TB) function and total cost (TC) function are respectively: TB=200Q−Q2 TC=200+20 Q+0,5 Q2
a. To maximize the total benefit, what is its quantity?
b. To maximize the net benefit, what is its quantity?
c. What the firm will do when Q = 50
d. What the firm will do when Q = 80 Solution:
a. To maximize the total benefit, what is its quantity?
TBmax MB=TB’(Q)=0 200-2Q=0 Q=100
b. To maximize the net benefit, what is its quantity? NBmax MB=MC MB=200-2Q MC=TC’(Q) = 20+Q 200-2Q=20+Q Q=60
c. What the firm will do when Q = 50
Q=50 MB=200-2*50=100 and MC = 20+50=70 MB>MC the firms should produce more (Q increases NB increases)
d.What the firm will do when Q = 80
Q=80 MB=200-2*80=40 and MC = 20+80=100 MBdecreases NB increases)
Lesson 1.2: Thinking like Economists
Assumption: Ceteris paribus: We assume that other things hold constant.
E.g., when we study the effects of price on quantity demanded. In addition to price, there are many
other factors that affect the demand for goods. BUT when we focus on the price-quantity demanded
nexus, you assume that other factors do not change.
Production Possibility Frontier (PPF):
Some important things, we must understand: 1. Understanding of PPF
2. The shape of PPF and its implications and why
3. Analyse changes in PPF due to the external factors. 1. Understanding of PPF
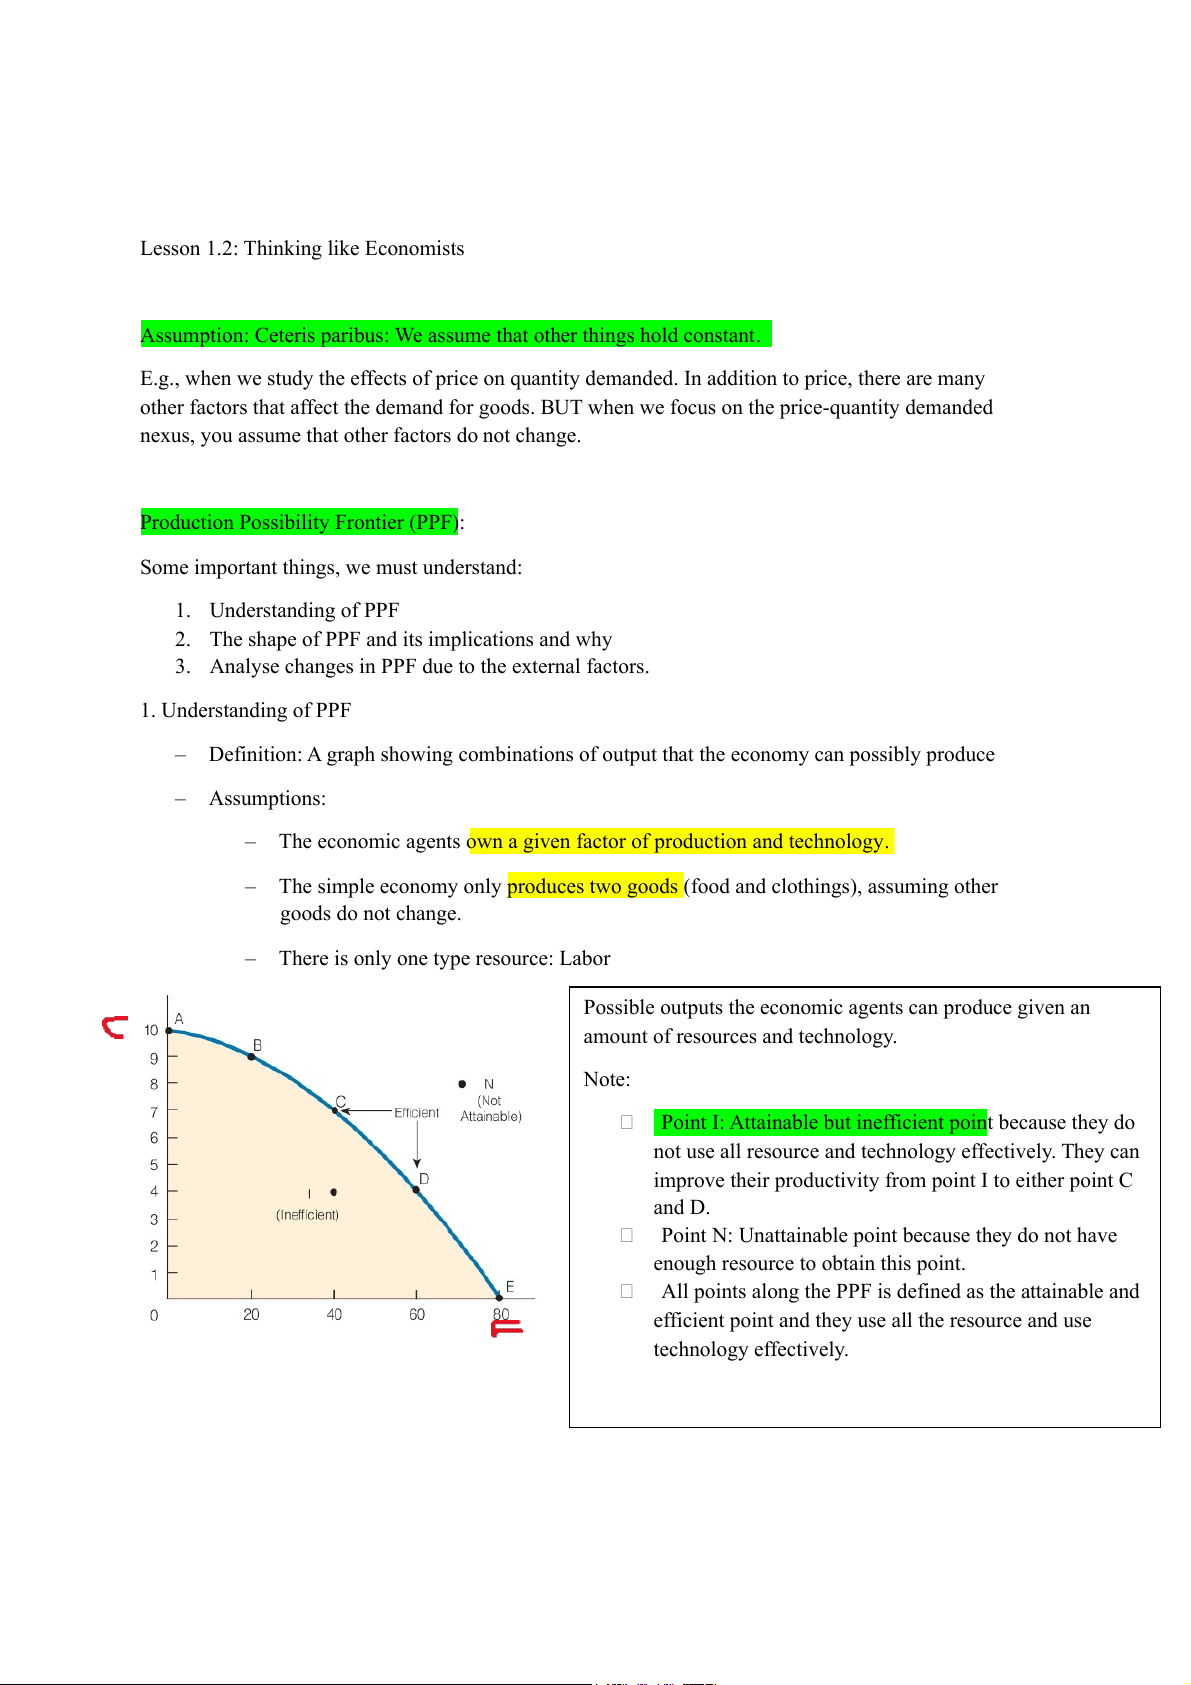
– Definition: A graph showing combinations of output that the economy can possibly produce – Assumptions:
– The economic agents own a given factor of production and technology.
– The simple economy only produces two goods (food and clothings), assuming other goods do not change.
– There is only one type resource: Labor
Possible outputs the economic agents can produce given an
amount of resources and technology. Note:
Point I: Attainable but inefficient point because they do
not use all resource and technology effectively. They can
improve their productivity from point I to either point C and D.
Point N: Unattainable point because they do not have
enough resource to obtain this point.
All points along the PPF is defined as the attainable and
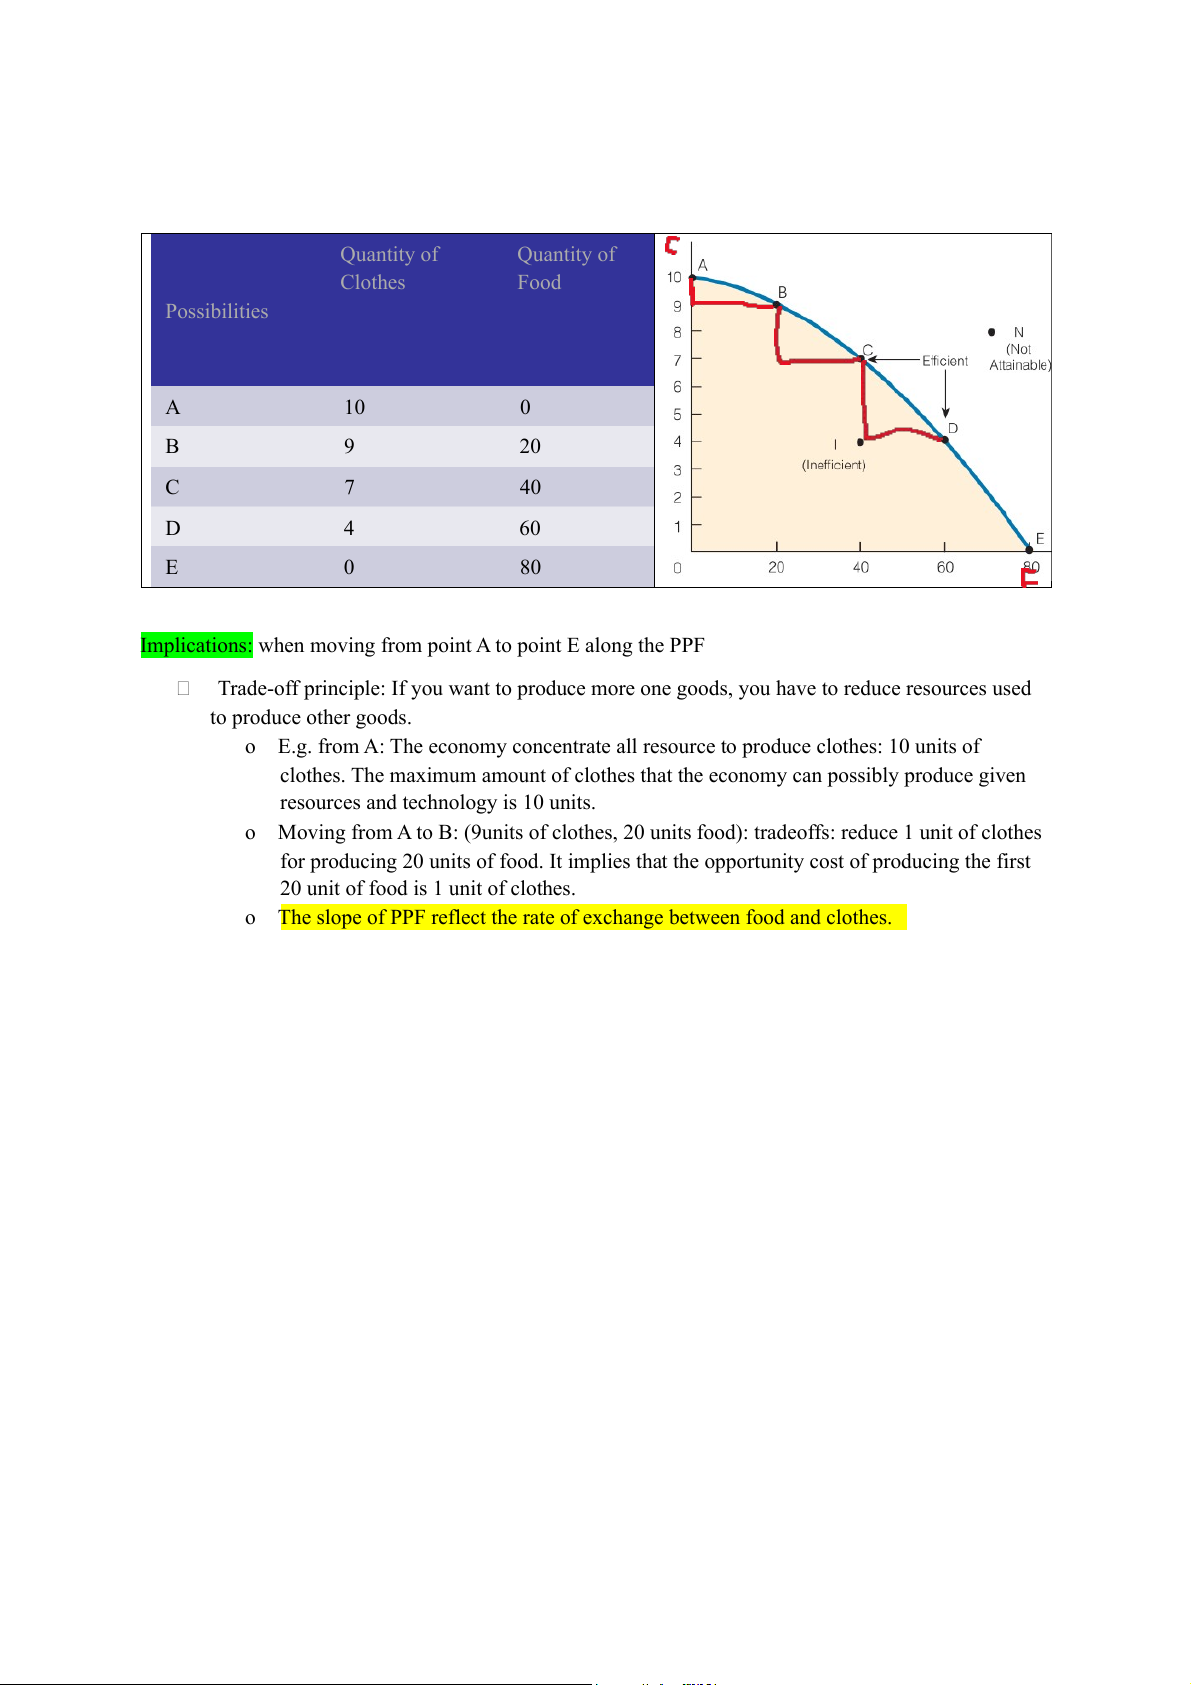
efficient point and they use all the resource and use technology effectively. Quantity of Quantity of Clothes Food Possibilities A 10 0 B 9 20 C 7 40 D 4 60 E 0 80
Implications: when moving from point A to point E along the PPF
Trade-off principle: If you want to produce more one goods, you have to reduce resources used to produce other goods.
o E.g. from A: The economy concentrate all resource to produce clothes: 10 units of
clothes. The maximum amount of clothes that the economy can possibly produce given
resources and technology is 10 units.
o Moving from A to B: (9units of clothes, 20 units food): tradeoffs: reduce 1 unit of clothes
for producing 20 units of food. It implies that the opportunity cost of producing the first
20 unit of food is 1 unit of clothes.
o The slope of PPF reflect the rate of exchange between food and clothes.
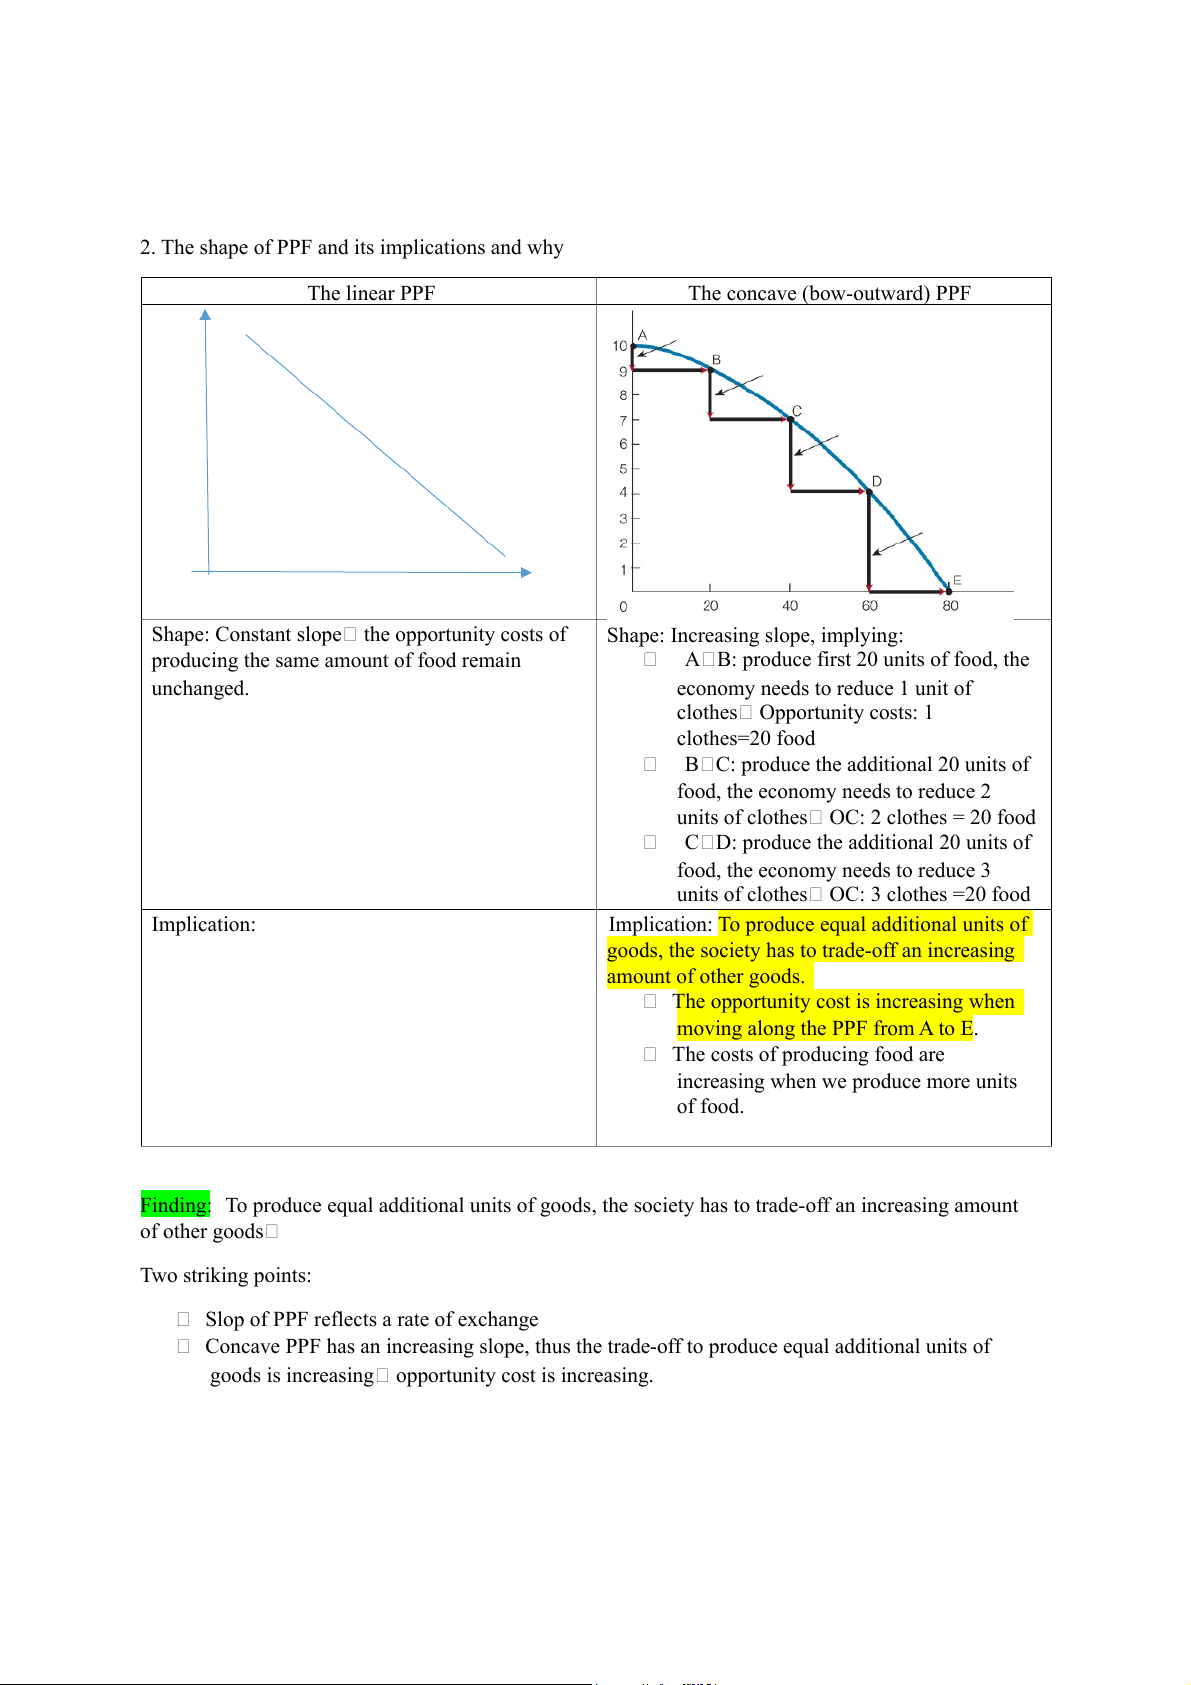
2. The shape of PPF and its implications and why The linear PPF The concave (bow-outward) PPF
Shape: Constant slope the opportunity costs of
Shape: Increasing slope, implying:
producing the same amount of food remain
A B: produce first 20 units of food, the unchanged.
economy needs to reduce 1 unit of clothes Opportunity costs: 1 clothes=20 food
B C: produce the additional 20 units of
food, the economy needs to reduce 2
units of clothes OC: 2 clothes = 20 food
C D: produce the additional 20 units of
food, the economy needs to reduce 3
units of clothes OC: 3 clothes =20 food Implication:
Implication: To produce equal additional units of
goods, the society has to trade-off an increasing amount of other goods.
The opportunity cost is increasing when
moving along the PPF from A to E.
The costs of producing food are
increasing when we produce more units of food.
Finding: To produce equal additional units of goods, the society has to trade-off an increasing amount of other goods Two striking points:
Slop of PPF reflects a rate of exchange
Concave PPF has an increasing slope, thus the trade-off to produce equal additional units of
goods is increasing opportunity cost is increasing.
Why does the cost of producing equal additional units of goods increase???
Assumption: there is one kind of resource used to produce food and clothes that is the labour. But there
are two type of labor: tailor and chef. Initially, there are 100 tailors and 100 chefs and the economy stands at point A in the PPF.
At point A, the economy uses 100 tailors and 100 chefs to produce 10 units of clothes
When move from point A to point B: the economy has to move some labor from producing
clothes to producing food. Considering two types of labor, they will move the chefs because
they are appropriate for producing food.
o A B: we need 60 chefs to produce the first 20 units of food 60 units of labor, in
general, to produce the first 20 units of food since all labors are appropriate.
o B C: since we only have 40 units of chefs, we need to move some tailors that is
inappropriate for producing food the economy needs 40 units of chefs and 40 units of
tailors 80 units of labor, in general, to produce the additional 20 units of food since
some labor is appropriate but some labors are not.
o C D: we run out of chefs, in order to produce the same of food, we need 120 units of
tailors 120 units of labor, in general, to produce the additional 20 units of food since all labors are inappropriate.
That explain why the opportunity costs of producing the same amount of food are increasing. Sum up: •
When the produced quantity is low, we only use appropriate resources that are inappropriately produce other goods. •
When the produced quantity increases, we have to use less appropriate resources that are
more appropriately used to produce other goods opportunity costs increase.
Some important things, we must understand: 1. Understanding of PPF
o A graph showing combinations of output that the economy can possibly produce
2. The shape of PPF and its implications and why o The tradeoff pricinple
o The concave (bow-outward) PPF means the opportunity costs of producing the same amount of good are increasing.
3. Analyse changes in PPF due to the external factors.
Three-step analysis principle to analyse changes in PPF:
Step 1: the shocks and external factor affect only one good or both of them
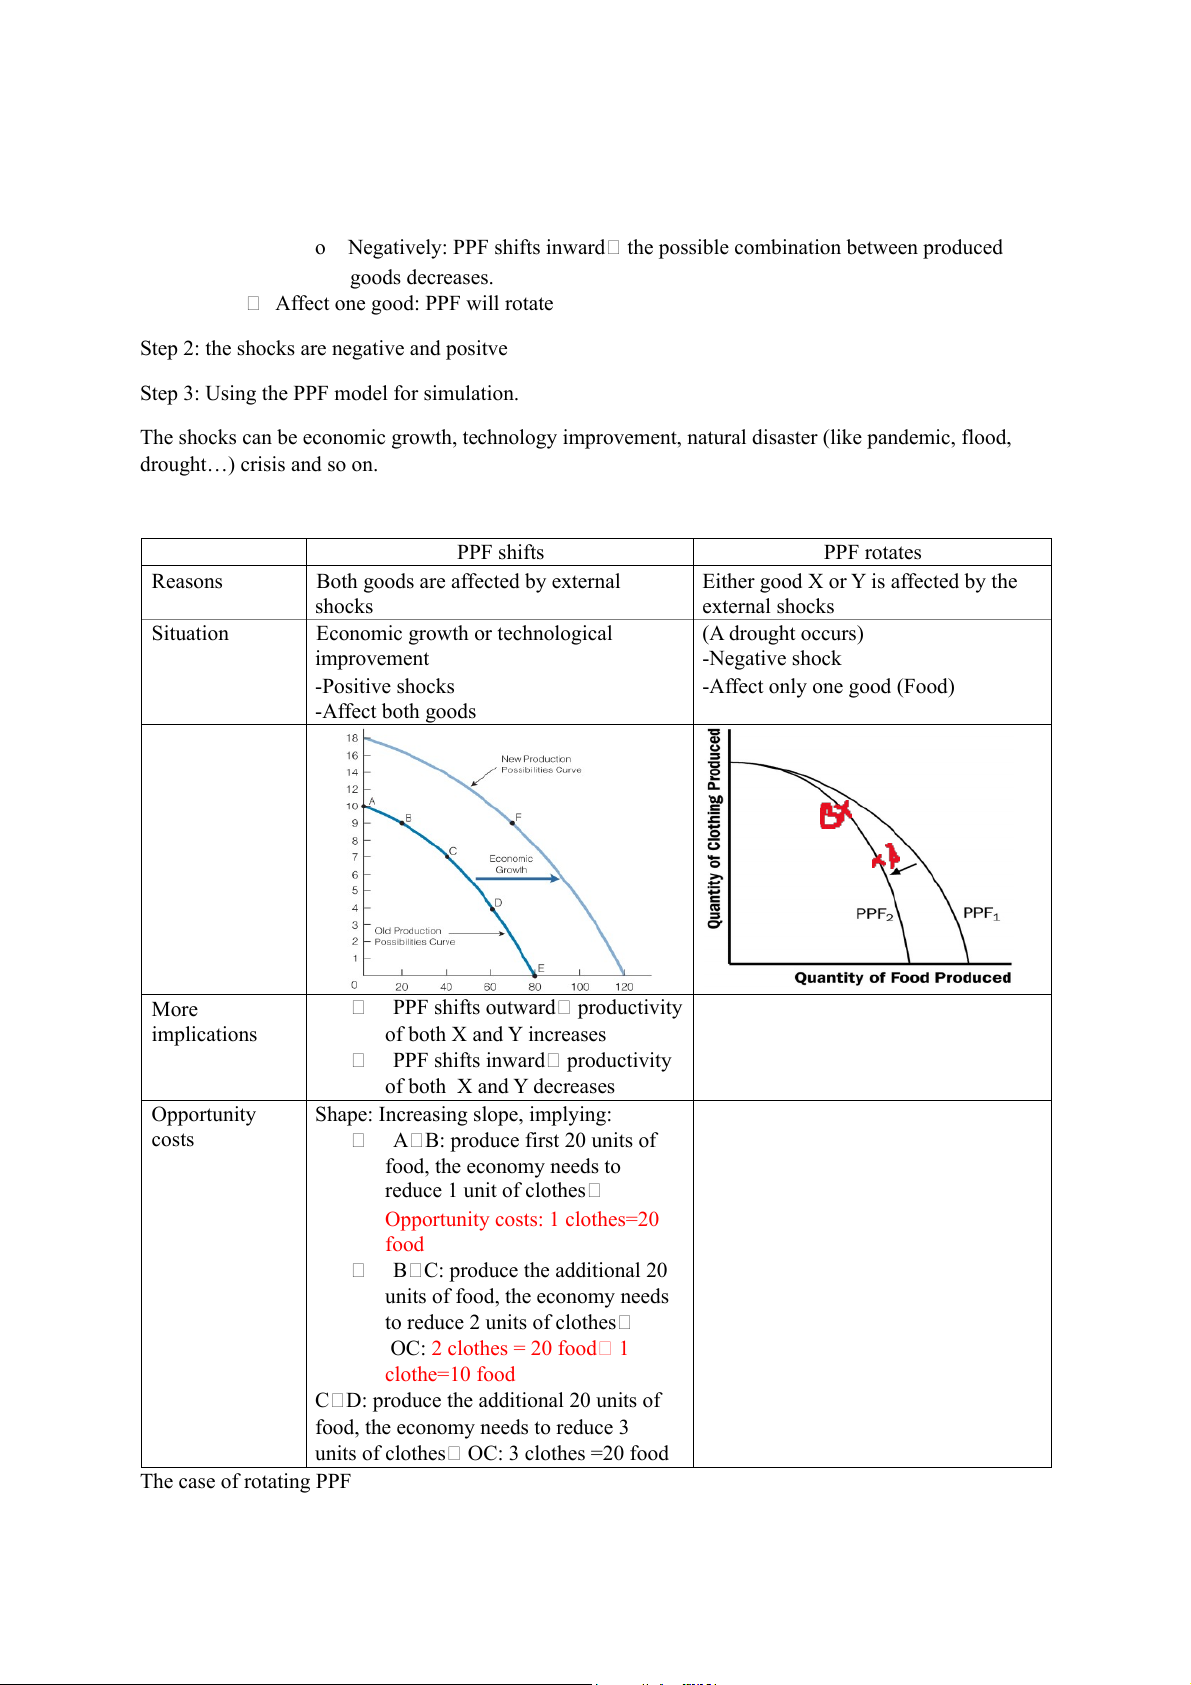
Affect two goods: PPF will shift
o Positively: PPF shifts outward the possible combination between produced goods increases.
o Negatively: PPF shifts inward the possible combination between produced goods decreases.
Affect one good: PPF will rotate
Step 2: the shocks are negative and positve
Step 3: Using the PPF model for simulation.
The shocks can be economic growth, technology improvement, natural disaster (like pandemic, flood, drought…) crisis and so on. PPF shifts PPF rotates Reasons
Both goods are affected by external
Either good X or Y is affected by the shocks external shocks Situation
Economic growth or technological (A drought occurs) improvement -Negative shock -Positive shocks -Affect only one good (Food) -Affect both goods More
PPF shifts outward productivity implications of both X and Y increases
PPF shifts inward productivity of both X and Y decreases Opportunity
Shape: Increasing slope, implying: costs
A B: produce first 20 units of food, the economy needs to reduce 1 unit of clothes
Opportunity costs: 1 clothes=20 food
B C: produce the additional 20
units of food, the economy needs to reduce 2 units of clothes OC: 2 clothes = 20 food 1 clothe=10 food
C D: produce the additional 20 units of
food, the economy needs to reduce 3
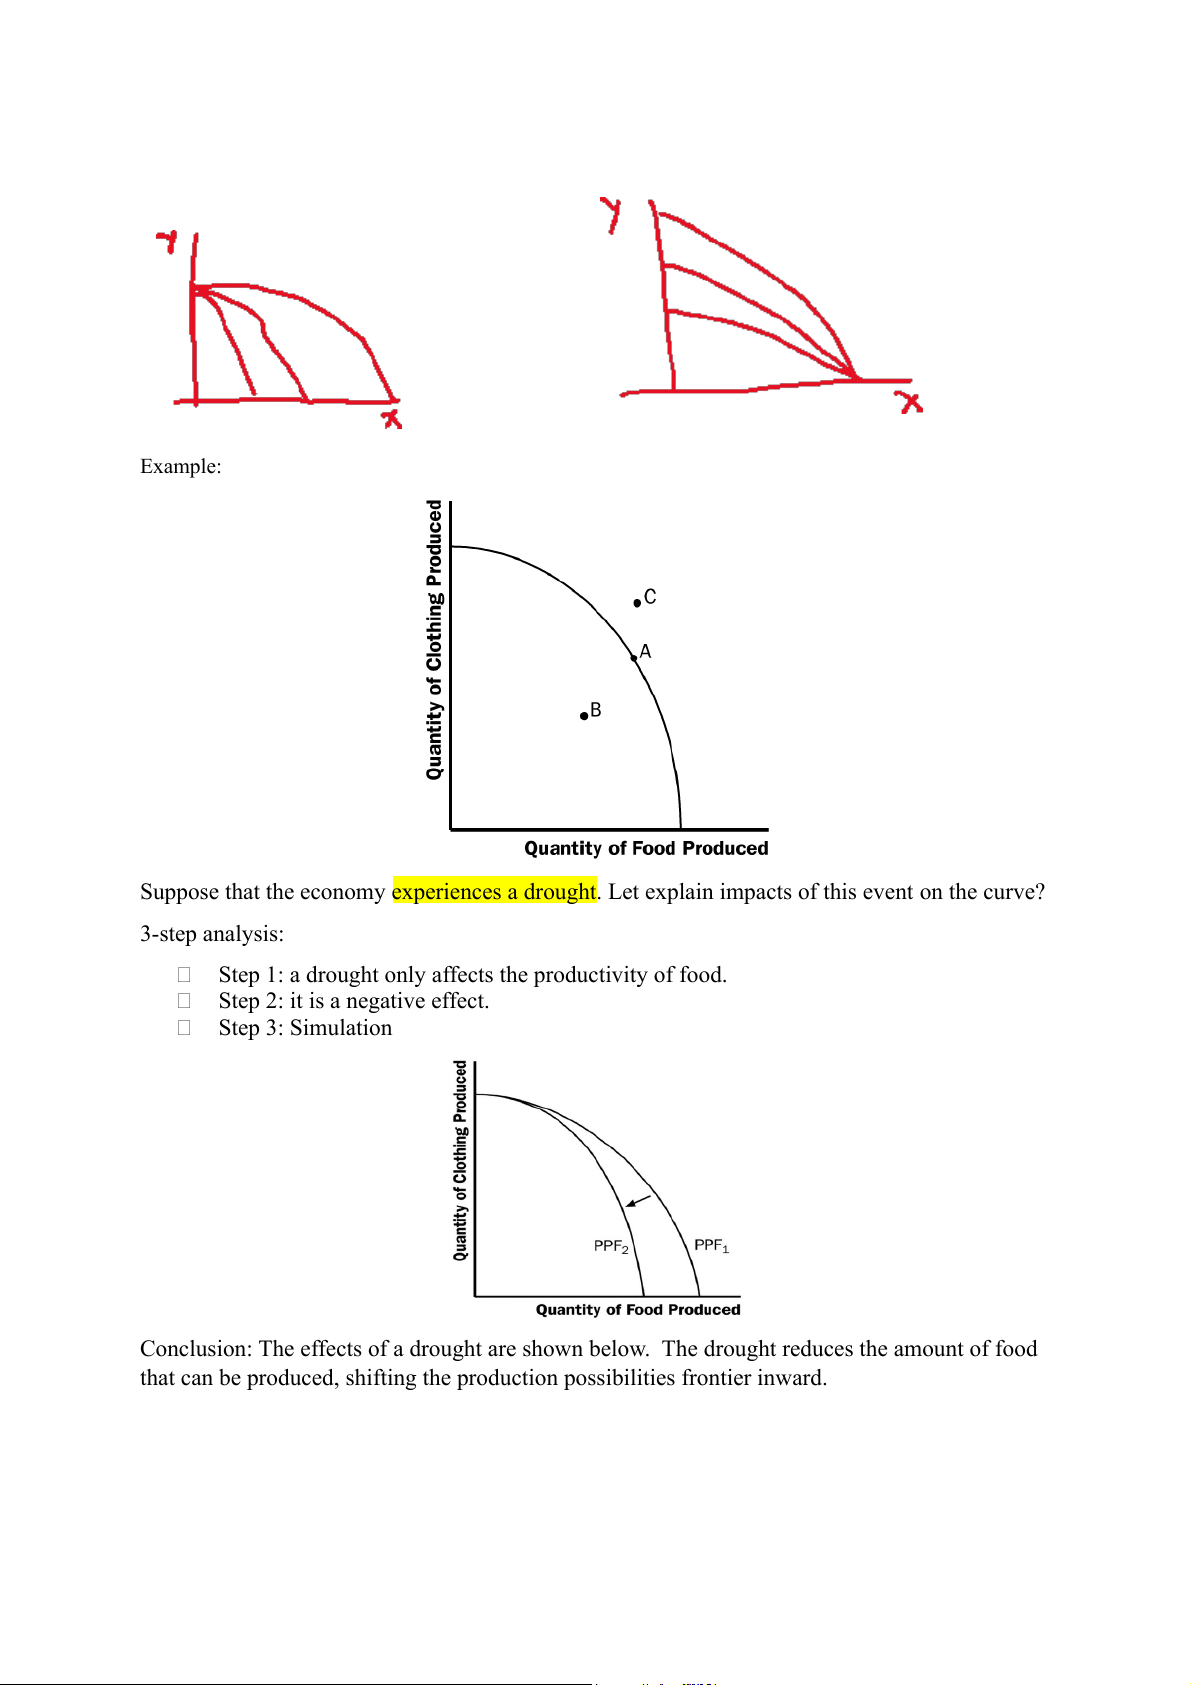
units of clothes OC: 3 clothes =20 food The case of rotating PPF Example:
Suppose that the economy experiences a drought. Let explain impacts of this event on the curve? 3-step analysis:
Step 1: a drought only affects the productivity of food.
Step 2: it is a negative effect. Step 3: Simulation
Conclusion: The effects of a drought are shown below. The drought reduces the amount of food
that can be produced, shifting the production possibilities frontier inward.
Tài liệu liên quan:
-

Chương 3: độ co giãn và các nhân tố ảnh hưởng | Microeconomics | Trường Đại học Quốc tế, Đại học Quốc gia Thành phố Hồ Chí Minh
3 2 -

Microeconomics Syllabus | Microeconomics | Trường Đại học Quốc tế, Đại học Quốc gia Thành phố Hồ Chí Minh
3 2 -

Microeconomics Course Syllabus & Assessment Details | Microeconomics | Trường Đại học Quốc tế, Đại học Quốc gia Thành phố Hồ Chí Minh
3 2 -

Assignment 3 - Elasticity MCQs and Key Concepts | Microeconomics | Trường Đại học Quốc tế, Đại học Quốc gia Thành phố Hồ Chí Minh
3 2 -

Assignment 2 - Economic Equilibrium Analysis of Fridges and Motorcycles | Microeconomics | Trường Đại học Quốc tế, Đại học Quốc gia Thành phố Hồ Chí Minh
3 2