Understanding Demand and Quantity Demanded Concepts | Microeconomics | Trường Đại học Quốc tế, Đại học Quốc gia Thành phố Hồ Chí Minh
The quantity demanded of a good or service is the amount that consumers plan to buy during a given period at a particular price. -The quantity demanded is not necessarily the same as the quantity actually bought. Sometimes the quantity demanđe exceeds the amount of goods available, so the quantity bought is less than the quantity demand. Tài liệu được sưu tầm và soạn thảo dưới dạng file PDF để gửi tới các bạn cùng tham khảo, ôn tập đầy đủ kiến thức, chuẩn bị cho các buổi học thật tốt. Mời bạn đọc đón xem!
Môn: Microeconomics 635 tài liệu
Trường: Trường Đại học Quốc tế, Đại học Quốc gia Thành phố Hồ Chí Minh 1.9 K tài liệu
Tác giả:
Preview text:
The quantity demanded of a good or service is the amount that consumers plan to
buy during a given period at a particular price.
-The quantity demanded is not necessarily the same as the quantity actually
bought. Sometimes the quantity demanđe exceeds the amount of goods available,
so the quantity bought is less than the quantity demanded.
For example, to attract customers, a candle shop offers a special discount on
the first day of every month with 30 products sold at 50,000 VNĐ. At this low
price, customers want and are willing to buy 40 candles, but the store only sell 30
of them so consumers can buy just 30 candles. Therefore, the demand is 40- the
quantity that consumers want to buy but the quantity of products that are actually sold is only 30.
-The quantity demanded is measured as an amount per unit of time.
For example, suppose that you buy a cup of coffee a day. The quantity of
coffee thát you demand can be expressed as 1 cup per day, 7 cups per week, or 365 cups per year.
We can say demand represents the ralationship between quantity demanded and price, ceteris paribus.
CHO MH XIN 1 CÁI ĐỒ THỊ Ở ĐÂY ))
For example, at the price of $5 per hot dog, consumers buy two hot dogs per
day; the quantity demanded is two. If vendors decide to increase the price of a hot
dog to $6, then consumers only purchase one hot dog per day. On a graph, the
quantity demanded moves leftward from two to one when the price rises from $5
to $6. If, however, the price of a hot dog decreases to $4, then customers want to
consume three hot dogs: the quantity demanded moves rightward from two to three
when the price falls from $5 to $4.
So we only need to notice that the graph of demand curve demonstrates the
realation between quantity demanded and price. Other factors that affects demand
such as income, market, price of related goods.. are considered to remained unchanged ( cateris paribus)
Ceteris paribus, literally "holding other things constant," is a Latin phrase
that is commonly translated into English as "all else being equal. A dominant
assumption in mainstream economic thinking, it acts as a shorthand indication of
the effect of one economic variable on another, provided all other variables remain the same.
The complicated nature of economics makes it difficult to account for all of
the possible variables that determine supply and demand, so ceteris paribus
assumptions simplify the equation so that the causal change can be isolated.
Suppose you wanted to explain the price of milk. With a little thought, it
becomes apparent that milk costs are influenced by numerous things: the
availability of cows, their health, the costs of feeding cows, the amount of useful
land, the costs of possible milk substitues, the number of milk suppliers, the level
of inflation in the economy, consumer preferences, transportation, and many other
variables. So an economist instead applies ceteris paribus, which essentially says if
all other factors remain constant, a reduction in the supply of milk-producing cows
causes the price of milk to rise.
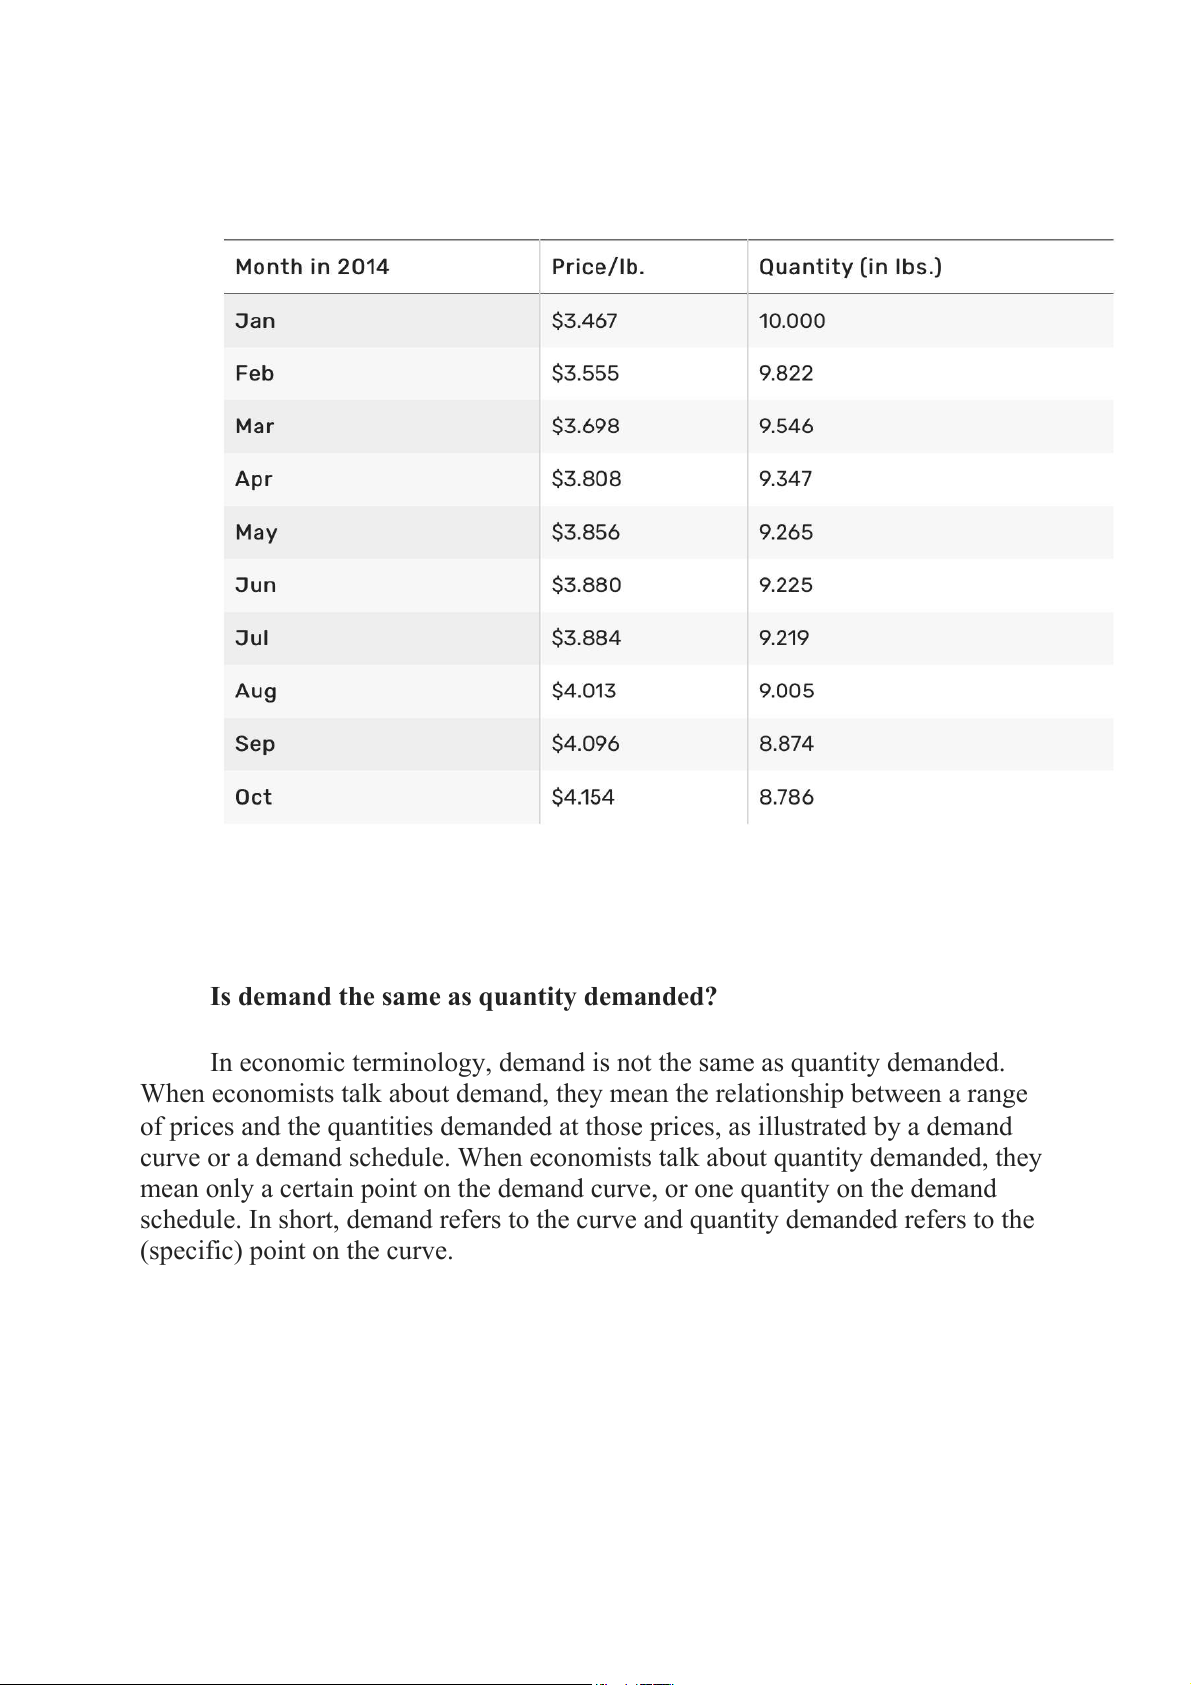
Thedemandschedule shows exactly how many units of a good or
service will be bought at each price. Using this data, economists and industry
analysts can create a demand curve. Both the curve and the schedule describe
the relationship between a good's price and the quantity demanded of that good.
Here's a real-life example of ground beef in 2014 . In part because of two
droughts in a row, the price of ground beef rose dramatically.
The first drought in 2012 drove up food prices and forced cattle ranchers to
slaughter their cows to prevent them from starving. In 2014, another drought
drove grain prices up again. Ranchers hadn't yet rebuilt their herds, so prices for
beef simply rose. Climate change is just one of the factors of rising food prices.
When oil prices rise, as they did in 2013 and 2014, it can be another reason why food prices are so high.
For this example, let's say a family of four bought 10 pounds of ground
beef in January to make hamburgers, meatloaf, and chili. All other things being
equal, here's the demand schedule showing how they would reduce the quantity
bought by 0.699% for every 1.0% the price rose.
Is demand the same as quantity demanded?
In economic terminology, demand is not the same as quantity demanded.
When economists talk about demand, they mean the relationship between a range
of prices and the quantities demanded at those prices, as illustrated by a demand
curve or a demand schedule. When economists talk about quantity demanded, they
mean only a certain point on the demand curve, or one quantity on the demand
schedule. In short, demand refers to the curve and quantity demanded refers to the (specific) point on the curve.
Tài liệu liên quan:
-

Chương 3: độ co giãn và các nhân tố ảnh hưởng | Microeconomics | Trường Đại học Quốc tế, Đại học Quốc gia Thành phố Hồ Chí Minh
4 2 -

Microeconomics Syllabus | Microeconomics | Trường Đại học Quốc tế, Đại học Quốc gia Thành phố Hồ Chí Minh
4 2 -

Microeconomics Course Syllabus & Assessment Details | Microeconomics | Trường Đại học Quốc tế, Đại học Quốc gia Thành phố Hồ Chí Minh
4 2 -

Assignment 3 - Elasticity MCQs and Key Concepts | Microeconomics | Trường Đại học Quốc tế, Đại học Quốc gia Thành phố Hồ Chí Minh
4 2 -

Assignment 2 - Economic Equilibrium Analysis of Fridges and Motorcycles | Microeconomics | Trường Đại học Quốc tế, Đại học Quốc gia Thành phố Hồ Chí Minh
4 2