Week 1 Presentation on Economic Production Analysis | Microeconomics | Trường Đại học Quốc tế, Đại học Quốc gia Thành phố Hồ Chí Minh
From point E to point D : the opportunity cost for the production of guided missiles increase from 0 to 12 (in thousands) is 2 millions cars (it means if the economy wants to increase the output of guided missiles from 0 to 12 thousand, it has to cut down the cars from 8 to 6 millions, by 2 millions). So to produce one more thousand missiles, the economy has to reduce the production of car, approximately 2:12≈0,1666(in millions). Tài liệu được sưu tầm và soạn thảo dưới dạng file PDF để gửi tới các bạn cùng tham khảo, ôn tập đầy đủ kiến thức, chuẩn bị cho các buổi học thật tốt. Mời bạn đọc đón xem!
Môn: Microeconomics 635 tài liệu
Trường: Trường Đại học Quốc tế, Đại học Quốc gia Thành phố Hồ Chí Minh 1.9 K tài liệu
Tác giả:
Preview text:
Name : Nguyễn Thị Phương Thảo Class : E-BBA 14.2 MSV: 11225935 Exercise 1
a. Graph the data in the table. Are there constant or increasing opportunity costs
for the production of missiles?
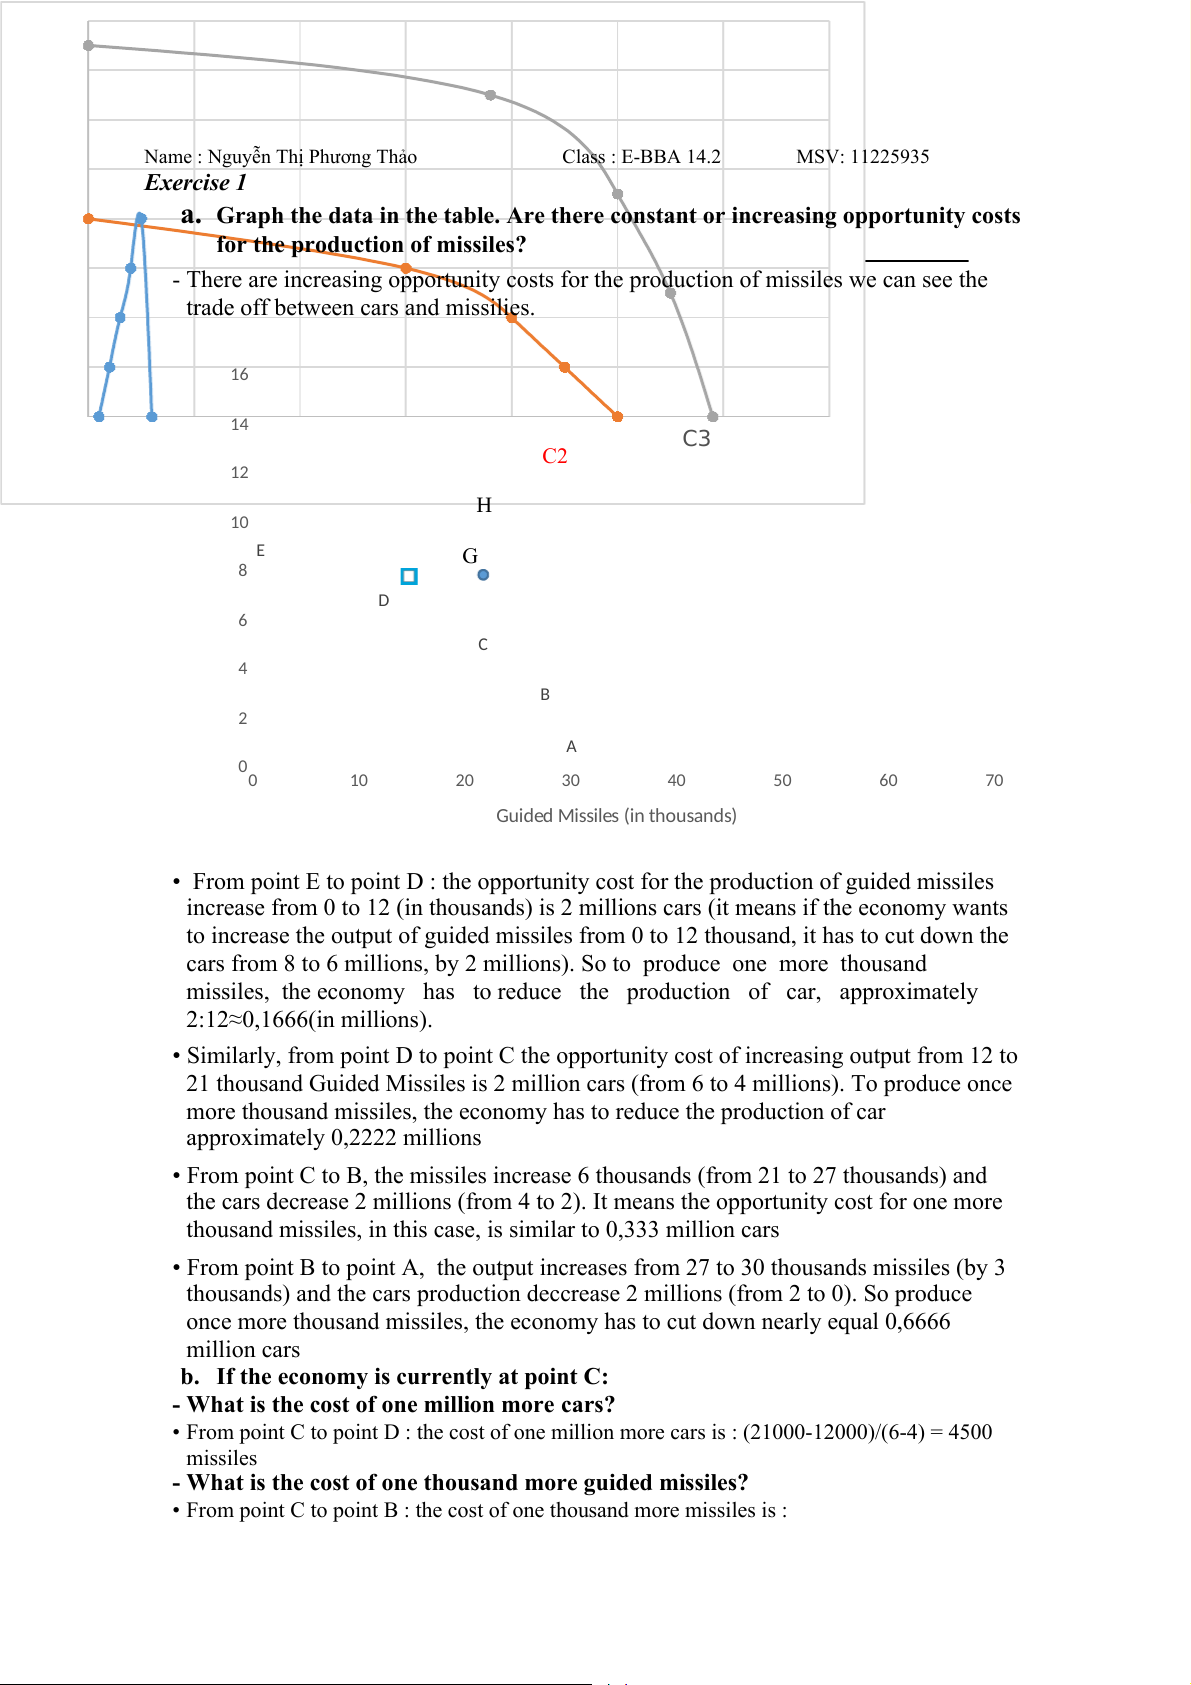
- There are increasing opportunity costs for the production of missiles we can see the
trade off between cars and missilies. 16 14 C3 C2 12 H 10 E illions) G 8 D rs (in m 6 Ca C 4 B 2 A 00 10 20 30 40 50 60 70 Guided Missiles (in thousands)
• From point E to point D : the opportunity cost for the production of guided missiles
increase from 0 to 12 (in thousands) is 2 millions cars (it means if the economy wants
to increase the output of guided missiles from 0 to 12 thousand, it has to cut down the
cars from 8 to 6 millions, by 2 millions). So to produce one more thousand
missiles, the economy has to reduce the production of car, approximately 2:12≈0,1666(in millions).
• Similarly, from point D to point C the opportunity cost of increasing output from 12 to
21 thousand Guided Missiles is 2 million cars (from 6 to 4 millions). To produce once
more thousand missiles, the economy has to reduce the production of car approximately 0,2222 millions
• From point C to B, the missiles increase 6 thousands (from 21 to 27 thousands) and
the cars decrease 2 millions (from 4 to 2). It means the opportunity cost for one more
thousand missiles, in this case, is similar to 0,333 million cars
• From point B to point A, the output increases from 27 to 30 thousands missiles (by 3
thousands) and the cars production deccrease 2 millions (from 2 to 0). So produce
once more thousand missiles, the economy has to cut down nearly equal 0,6666 million cars
b. If the economy is currently at point C:
- What is the cost of one million more cars?
• From point C to point D : the cost of one million more cars is : (21000-12000)/(6-4) = 4500 missiles
- What is the cost of one thousand more guided missiles?
• From point C to point B : the cost of one thousand more missiles is :
(4000000-2000000)/(27-21) = 1000000/3 = 1/3 million cars
c. Label a point G inside the curve of the graph. What does it indicate?
Point G indicates the economic output are 2 millions cars and 21 thousands missiles. This
data show that the economy is inefficiency in use resources (unemployment, productive
inefficiency, or both). Because if it produces 2 million cars, the most of the missiles it can
produce is 27 thousand missiles; and if it produces 21 thousand missiles, the most cars it can produce is 4 million cars.
d. Label a point H that lies outside the PPF curve.
- What does this point indicate?
• A point H, which is indicate the output that 10 millions cars and 20 thousands missilies,
lies outside the PPF curve show the impossible production of cars and missiles because of the fixed resources.
- What must occur before the economy can attain the level of production indicated by point H?
• To attain the level of production indicated by point H, Economic growth through more
inputs, better inputs, improved technology to increase the efficiency of resources such as
human resource, save more materials,... must be achieved.
e. Suppose improvement occurs in the technology of producing guided missiles
but not in the production of cars.
- Curve C2 show the improvement occurs in the technology of producing guided
missiles but not in the production of cars.
Now draw a curve that reflects technological improvement in the production of both products.
- Curve C3 show the technological improvement in the production of both products. Exercise 2
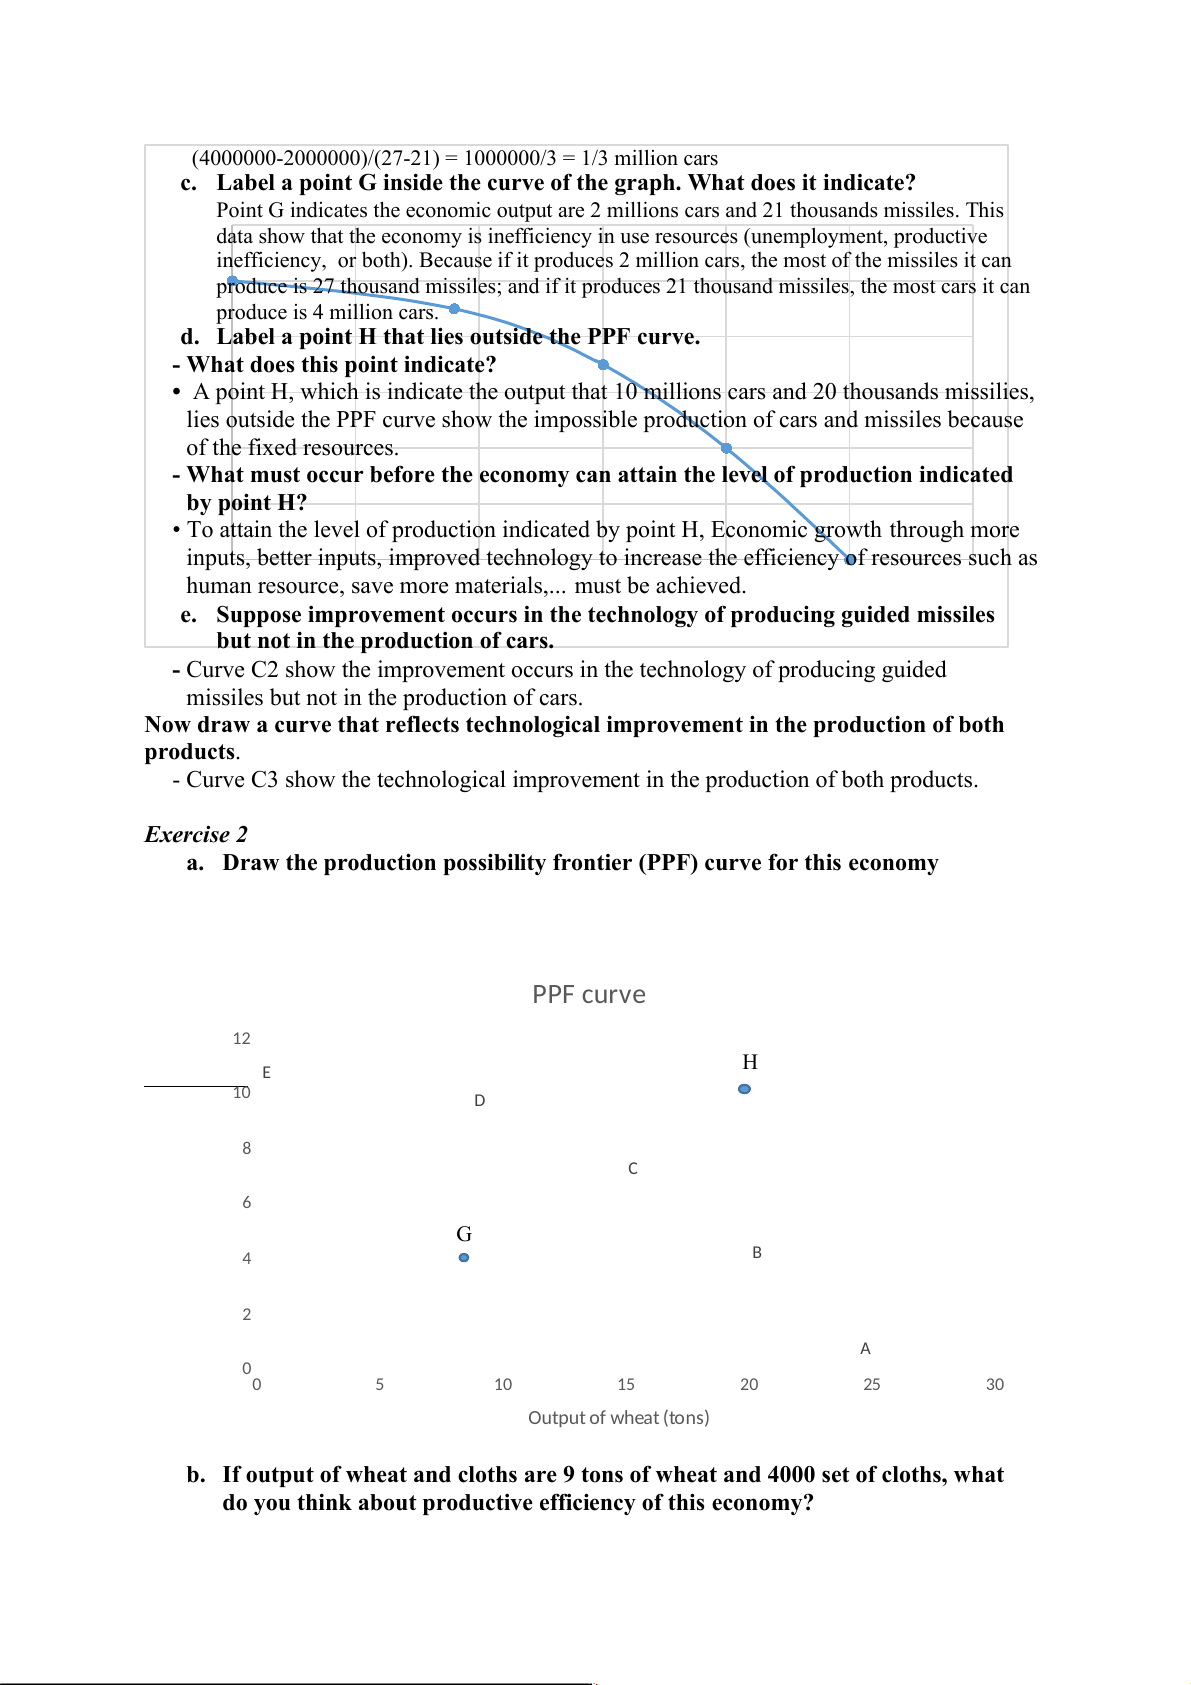
a. Draw the production possibility frontier (PPF) curve for this economy PPF curve 12 H E 10 D t) se 8 00 C (10 6 loths G of c 4 B Output 2 A 00 5 10 15 20 25 30 Output of wheat (tons)
b. If output of wheat and cloths are 9 tons of wheat and 4000 set of cloths, what
do you think about productive efficiency of this economy?
- If output of wheat and cloths are 9 tons of wheat and 4000 set of cloths, i think the
productive of this economy is ineffictive. If resources are used effectively, the output
would be 20 tons of wheat and 4000 set of cloths. On the other hand, if 9 tons of wheat
are produced, we could have 9000 set of cloth. The point would lie inside the
production possibility frontier, at point G in the diagram.
c. Can this economy produce 20 tons of wheat and 10 000 set of cloths ?
- This economy can’t produce 20 tons of wheat and 10000 set of cloth. Because of the
scarcity and fixed resources, if you want to produce 20 tons of wheat, you just had
4000 set of cloths or if you want to produce 10000 set of cloths, you hadn’t any tons of
wheat. The point would lie outside the production possibility frontier, at point H in the diagram.
d. Calculate opportunity costs of producing wheat and cloths?
- The opportunity costs of producing wheat :
• From point E to point D : the output of wheat increase 9 tons (from 0 to 9 tons) and the
output of cloths decrease 1000 set (from 10000 to 9000 set)
The opportunity costs to increase 1 ton of wheat is: (10-9)/(9-0)= 1/9 (1000 set of cloths)
• Similarly, the opportunity costs for one more ton of wheat from point D to point C :
(9-7)/(15-9) =1/3 (1000 set of cloths) • From point C to point B :
(7-4)/(20-15)= 3/5 = 0,6 (1000 set of cloths) • From point B to point A :
(4-0)/(25-20)= 4/5 = 0,8 (1000 set of cloths)
- The opportunity costs of producing cloths
• The opportunity costs for one more 1000 set of cloths from point A to point B :
(25-20)/(4-0) = 1,25 (tons of wheat)
• The opportunity costs for one more 1000 set of cloths from point B to point C :
(20-15)/(7-4) = 5/3 (tons of wheat)
• The opportunity costs for one more 1000 set of cloths from point C to point D :
(15-9)/(9-7) = 3 (tons of wheat)
• The opportunity costs for one more 1000 set of cloths from point D to point E :
(9-0)/(10-9) = 1 (ton of wheat)
Tài liệu liên quan:
-

Chương 3: độ co giãn và các nhân tố ảnh hưởng | Microeconomics | Trường Đại học Quốc tế, Đại học Quốc gia Thành phố Hồ Chí Minh
3 2 -

Microeconomics Syllabus | Microeconomics | Trường Đại học Quốc tế, Đại học Quốc gia Thành phố Hồ Chí Minh
3 2 -

Microeconomics Course Syllabus & Assessment Details | Microeconomics | Trường Đại học Quốc tế, Đại học Quốc gia Thành phố Hồ Chí Minh
3 2 -

Assignment 3 - Elasticity MCQs and Key Concepts | Microeconomics | Trường Đại học Quốc tế, Đại học Quốc gia Thành phố Hồ Chí Minh
3 2 -

Assignment 2 - Economic Equilibrium Analysis of Fridges and Motorcycles | Microeconomics | Trường Đại học Quốc tế, Đại học Quốc gia Thành phố Hồ Chí Minh
3 2