A Report - Laboratory experiment 9 : Solvent effects in an SN1 solvolsis reaction a kinetics study | Bài báo cáo học phần Chemical Engineering | Trường Đại học Quốc tế, Đại học Quốc gia Thành phố Hồ Chí Minh
The influence of solvents is of the highest priority in SN1 reactions, especially in solvolysis processes. These reactions include the substitution of a molecule with the aid of a solvent molecule that acts as a nucleophile. The kinetics study of SN1 solvolysis includes examining the influence of variations in solvent type, concentration, and characteristics on the reaction rate. Then can gain insights into how solvent effects impact reaction speeds and processes by conducting experiments that use different solvents with varying characteristics. The study generally entails graphing reaction rates in relation to various solvent characteristics, such as polarity and nucleophilicity, in order to identify patterns and associations. Tài liệu giúp bạn tham khảo, ôn tập và đạt kết quả cao. Mời bạn đón xem.
Môn: Chemical Engineering 10 tài liệu
Trường: Trường Đại học Quốc tế, Đại học Quốc gia Thành phố Hồ Chí Minh 2 K tài liệu
Tác giả:


Preview text:
Table of Contents
I. ABSTRACT ......................................................................................................................................... 3
II. INTRODUCTION ................................................................................................................................. 3
III. MATERIALS AND METHODS ........................................................................................................ 4
• Materials: ............................................................................................................................................. 4
• Methods: ............................................................................................................................................... 4
IV. RESULT AND DISCUSSION ............................................................................................................. 6
• Result: ................................................................................................................................................... 6
• Discussion: ............................................................................................................................................ 7
V. CONCLUSION .................................................................................................................................. 8
VI. LAB NOTES ........................................................................................................................................ 9 2 I. ABSTRACT
The influence of solvents is of the highest priority in SN1 reactions, especially in solvolysis
processes. These reactions include the substitution of a molecule with the aid of a solvent molecule
that acts as a nucleophile. The kinetics study of SN1 solvolysis includes examining the influence
of variations in solvent type, concentration, and characteristics on the reaction rate. Then can gain
insights into how solvent effects impact reaction speeds and processes by conducting experiments
that use different solvents with varying characteristics. The study generally entails graphing
reaction rates in relation to various solvent characteristics, such as polarity and nucleophilicity, in
order to identify patterns and associations.
The objective is to examine the impact of different solvent characteristics on the rate of an
SN1 solvolysis reaction. Firstly, a substance that reacts easily, often an alkyl halide, is mixed with
various solvents that have various levels of polarity and nucleophilicity. The reaction is
subsequently triggered, either by introducing a nucleophile or using a stimulating agent such as
heat. Then add three drops 0.5 N sodium hydroxide solution and 1-2 drops of phenolphthalein
indicator. Add three drops of t-butyl chloride to each tube individually. Immediately agitate or stir
the contents of the tube and accurately note the time of the addition, rounding to the closet second.
Keep shaking until the pink color vanishes, proceed to record the time once more. Perform this
process for every solvent system. The experimental results of this study regarding the influence of
solvents on SN1 solvolysis reactions demonstrated substantial associations between solvent
characteristics and reaction rates. Furthermore, solvents with higher nucleophilicities had a
competitive effect, directly influencing the rate by acting as nucleophiles themselves. II. INTRODUCTION
This experiment is designed to study the kinetics of a solvolysis reaction. A solvolysis
reaction is an SN1 reaction in which the solvent is the nucleophile. An SN1 reaction substitution
reaction that proceeds by a two-step mechanism. In the first stage, the leaving group dissociates,
resulting in the creation of a carbocation intermediate. In the second step, the nucleophile attacks
the carbocation. The rate of an SN1 reaction is only affected by the substrate concentration, while
the nucleophile, while the nucleophile concentration has no influence. Hence, the initial phase, in
which the reaction rate is mostly influenced by the stability of the carbocation and the leaving
group’s ability, is considered the rate-determining step. In this experiment, investigate the kinetics 3
of solvolysis process involving t-butyl chloride in several solvents. The objective is to examine the
influence of solvent polarity on both the rate constant and the activation energy of the reaction. III. MATERIALS AND METHODS • Materials: o 2 burets o 6mL Acetone o 1 micropipette
o 6mL 95% ethanol o 1 plastic pipette o 6mL Methanol o 2 glass pipettes o Phenolphthalein indicator o Clock o Sodium bicarbonate
o 1 beaker 250mL o A few drops t-butyl chloride, less than o 1 beaker 100mL 5 mL
o 15 test tubes, 13 x 100 mm, with corks
o A few drops 0.5 M sodium hydroxide,
o Thermometer less than 5 mL o Aluminum foil • Methods:
In experiment 9, there are a few differences from those previous experiments in setup and
solvent system. The solvent system will be followed by the table below. Since there are up to 15
separated mixtures that will be evaluated, highly recommend testing the solvent on the set from 3
to 5 tubes per test. You should schedule your different runs to overlap since each reaction takes 5
to 30 minutes (depending on the solvent mixture).
Table 1: the solvent system for experiment SOLVENT MIXTURES COMPOSITION
PERCENT BY VOLUME VOLUMES FOR 2.0 mL OF MIXTURE SOLVENT: WATER SOLVENT WATER 50:50 1.0 mL 1.0 mL 4 55:45 1.1 mL 0.9 mL 60:40 1.2 mL 0.8 mL 65:35 1.3 mL 0.7 mL 70:30 1.4 mL 0.6 mL
In a test tube that has been cleaned and labeled, add 2.0 mL of the suitable solvent mixture.
Then, start to add the appropriate amount of solvent and distilled water using the micropipette.
After that, to achieve thermal equilibrium, cork the test tubes and submerge them in a bath of
constant temperature for approximately five minutes. For the duration of the experiment, keep the water bath at 30°C, and:
+ Add 1-2 tubes of phenolphthalein indicator and 3 drops of 0.5N sodium hydroxide solution to each test tube.
+ Add three droplets of t-butyl chloride to each tube one at a time.
As soon as possible, shake or mix the contents in the tube, then note the addition's time to
the closest second, and keep shaking. Compute the reaction time elapsed in each solvent system,
rounding to the closest 0.1 minutes. Plot the amount of water in each solvent system against the
passing of time. All three plots should be placed on one graph. Make notes of your findings and
conclusions after comparing the three graphs. 5 IV. RESULT AND DISCUSSION • Result:
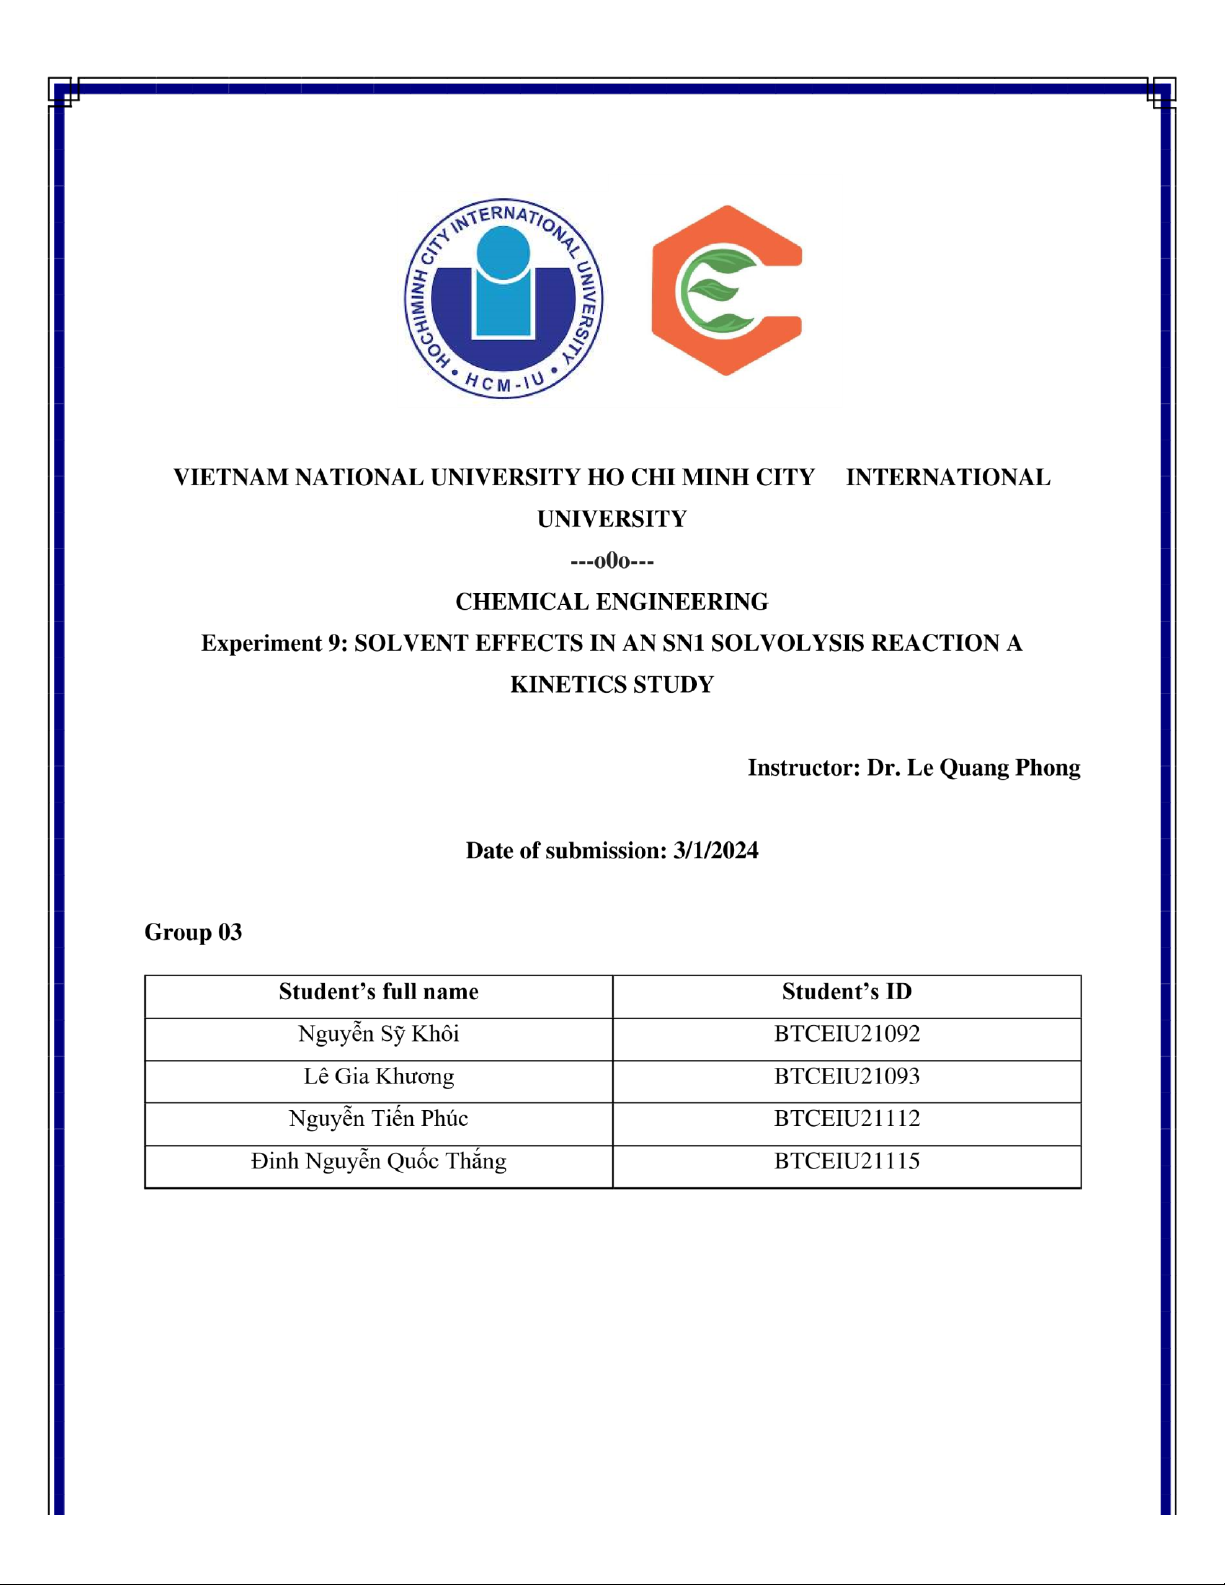
Figure 1: Sample after adding 3 drops of 0.5N sodium hydroxide solution and 2 drops of phenolphthalein indicator.
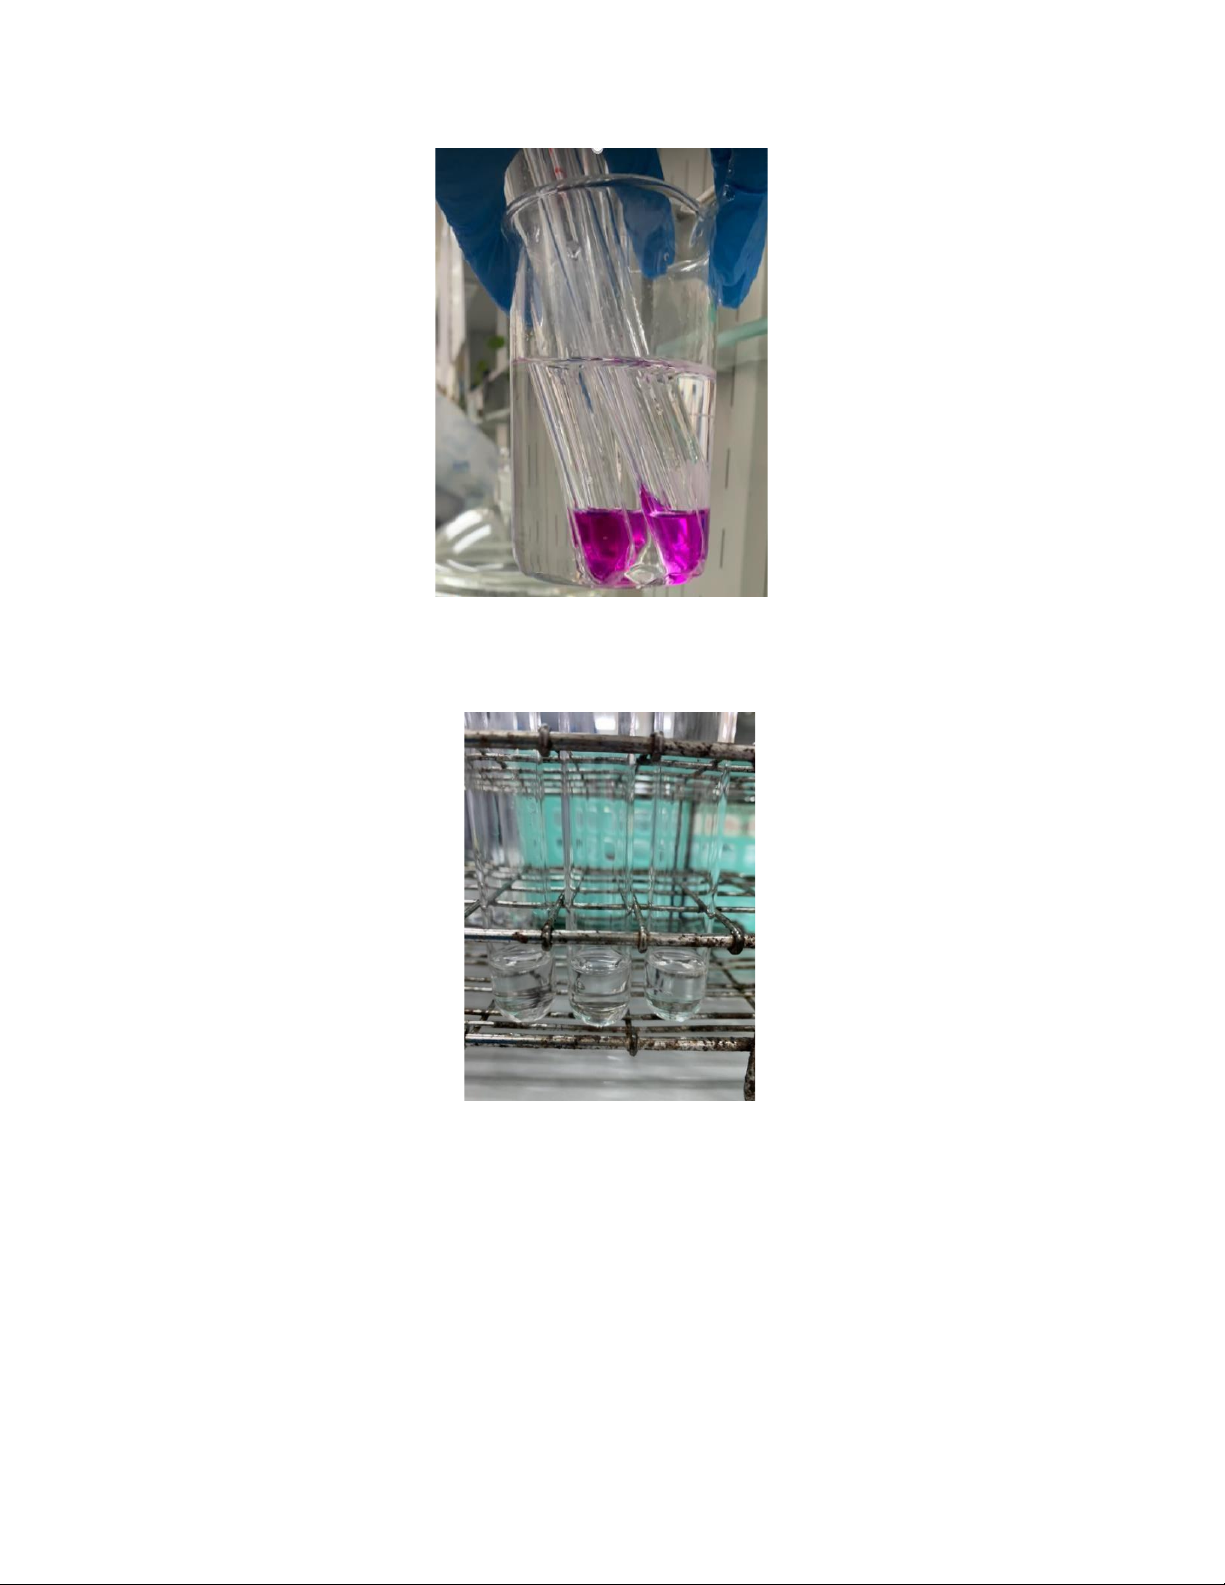
Figure 2: Sample after shaking.
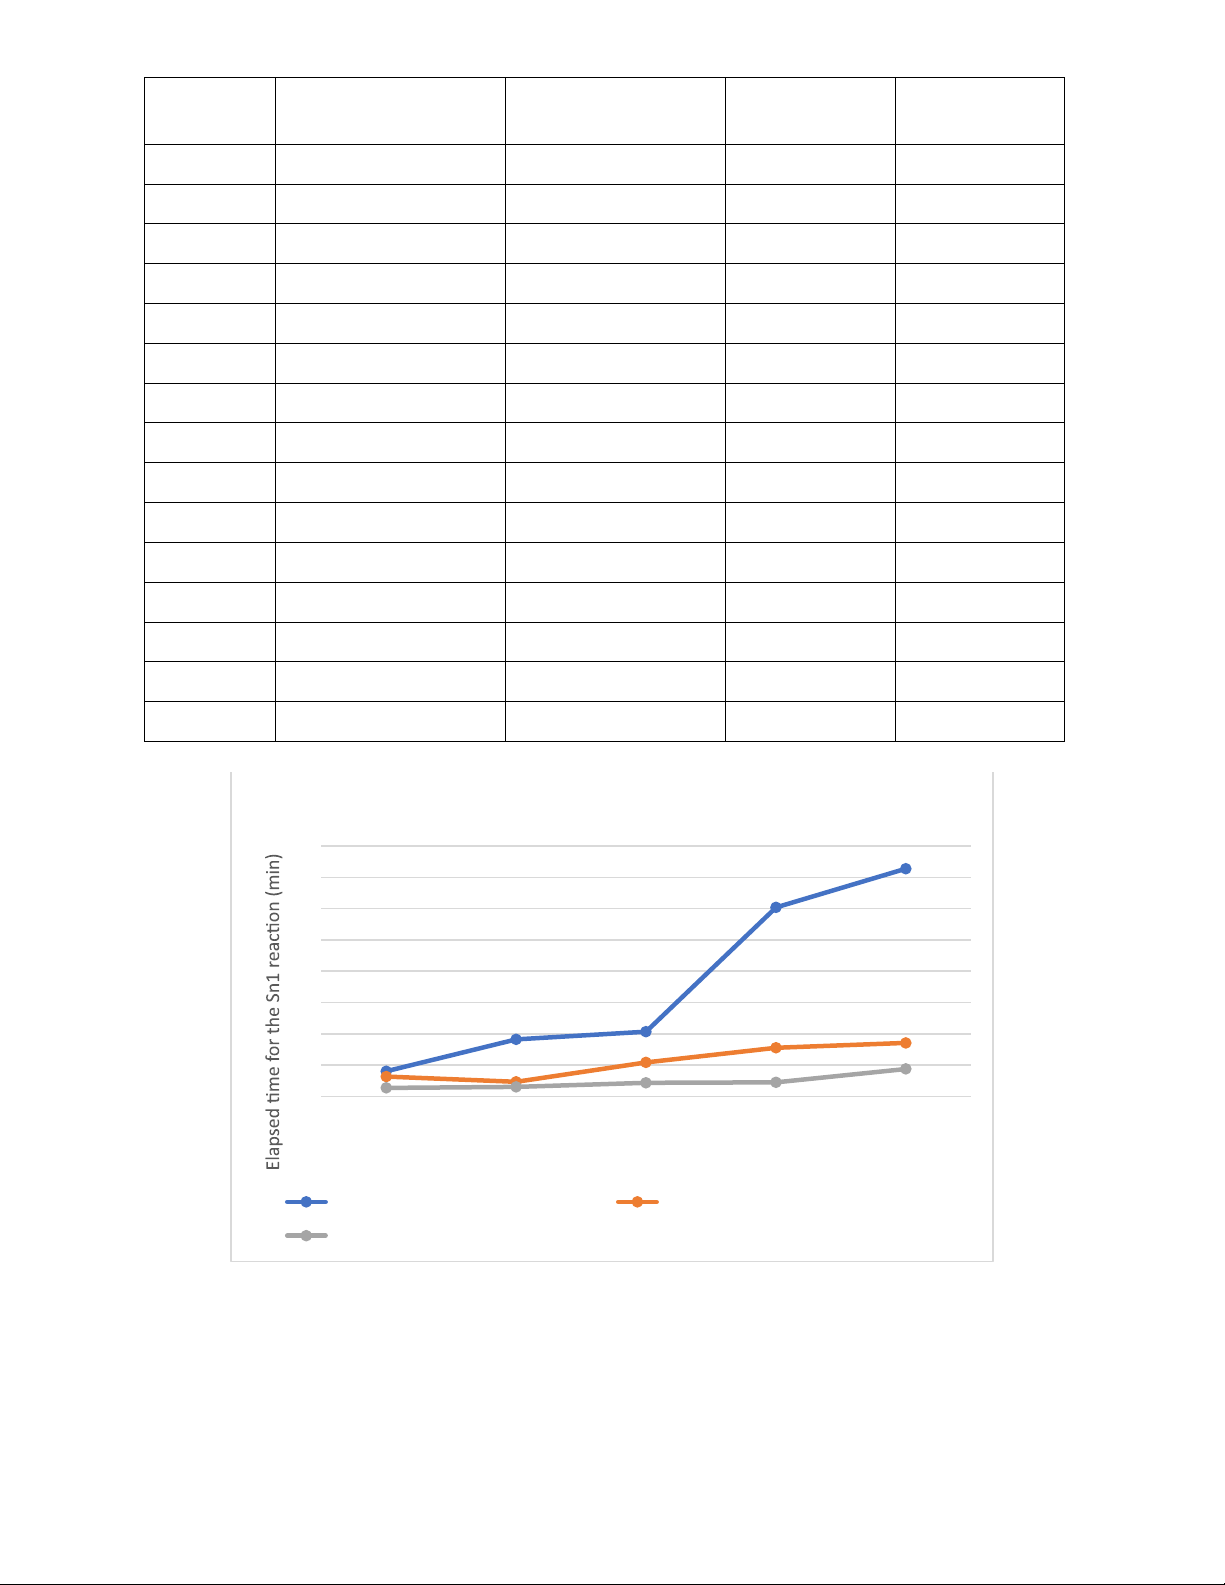
According to data in table below, the experiment included testing different solvent
mixtures: acetone with water, methanol with water, and ethanol with water at various ratios. The
mixture of acetone and water require the longest shaking time, while methanol and water have
lowest shaking time. As the water content decreases, the shaking time generally increases. Test
tubes 6 and 7 have problems, though; test tube 7 has a lower water ratio but a shorter shaking duration. 6
Table 2: Data collected. Test tube Solvent mixture Ratio: Percentage Shaking time Elapsed (solvent-mixture) time(min) 1 Acetone and water 50:50 8mins 8 2 Acetone and water 55:45 18mins14s 18.23 3 Acetone and water 60:40 20mins40s 20.67 4 Acetone and water 65:35 60mins25s 60.42 5 Acetone and water 70:30 72mins48s 72.8 6 Ethanol and water 50:50 6mins20s 6.33 7 Ethanol and water 55:45 4mins37s 4.62 8 Ethanol and water 60:40 10mins49s 10.82 9 Ethanol and water 65:35 15mins30s 15.5 10 Ethanol and water 70:30 17mins04s 17.07 11 Methanol and water 50:50 2mins40s 2.67 12 Methanol and water 55:45 3mins02s 3.03 13 Methanol and water 60:40 4mins19s 4.32 14 Methanol and water 65:35 4mins25s 4.42 15 Methanol and water 70:30 8mins43s 8.72 Elapsed time 80 70 60 50 40 30 20 10 0 50:50 55:45 60:40 65:35 70:30 Ratio of H2O in solvent
Elapsed time of Acetone:H2O solvent
Elapsed time of Ethanol:H2O solvent
Elapsed time of Methanol:H2O solvent • Discussion:
Polar protic solvents enhance the rate of SN1 reactions. The presence of a polar solvent is
crucial in stabilizing both the transition state and carbocation intermediate, which are the critical
stages in determining the speed of the SN1 reaction. The large dipole moment of the solvent 7
interacts with the substrate, resulting in a reduction in the energy of the transition state. A solvent
with a high degree of polarity will provide more stability to a charged ionic species, such as a
carbocation, compared to a solvent with low polarity.
Both Methanol and Ethanol are polar protic solvents, so it increased the SN1 reaction rate
better than Acetone, which is not a polar protic solvent. Phenolphthalein was added to the mixture
to observe the pH change of buffer. The less time the color changes from pink to colorless, the
better the reaction rate is. In Acetone: Water solution, only water joins in the solvolysis reaction,
so it took a lot of time for the SN1 reaction to form HCl as a product that reduced pH and changed
the pink color of phenolphthalein to colorless. Compared between the efficiency of methanol and
ethanol in SN1 reaction, methanol (CH3OH) has less electron donating group than ethanol
(CH3CH2OH) which makes the acidic hydrogen in methanol easier to leave. In other words, the
more polar protic solvent increases the SN1 reaction rate better because it increases the acidity of hydrogen.
Due to technical errors when adding t-butyl chloride and ethanol, the amount of them were
not similar in each tube, especially between tube 6 and tube 7. Drop t-butyl chloride and ethanol
fast would deliver less amount of it than drop it slowly. That is why test tube 7 has a lower water
ratio than tube 6 but a shorter shaking duration. V. CONCLUSION
In conclusion, the investigation into solvent effects in an SN1 solvolysis reaction provided
a comprehensive understanding of the intricate relationship between solvent characteristics and
reaction kinetics. The systematic exploration of various solvents revealed discernible patterns, with
polar and nucleophilic solvents demonstrating a pronounced impact on reaction rates. The observed
correlation underscored the significance of nucleophilic solvation in influencing the stability and
reactivity of carbocation intermediates. These findings contribute not only to the fundamental
understanding of reaction mechanisms but also offer practical insights for optimizing reaction
outcomes in organic synthesis. The experiment's results emphasize the pivotal role of solvent
selection as a strategic parameter for controlling and manipulating chemical reactions. As we delve
deeper into the complexities of solvent-solute interactions, this study serves as a catalyst for future
research endeavors, encouraging further exploration of solvent effects in diverse chemical
processes. Ultimately, the knowledge gained from this kinetics study enriches our toolbox for
designing and predicting reactions, contributing to the advancement of organic chemistry and reaction dynamics. 8 VI. LAB NOTES
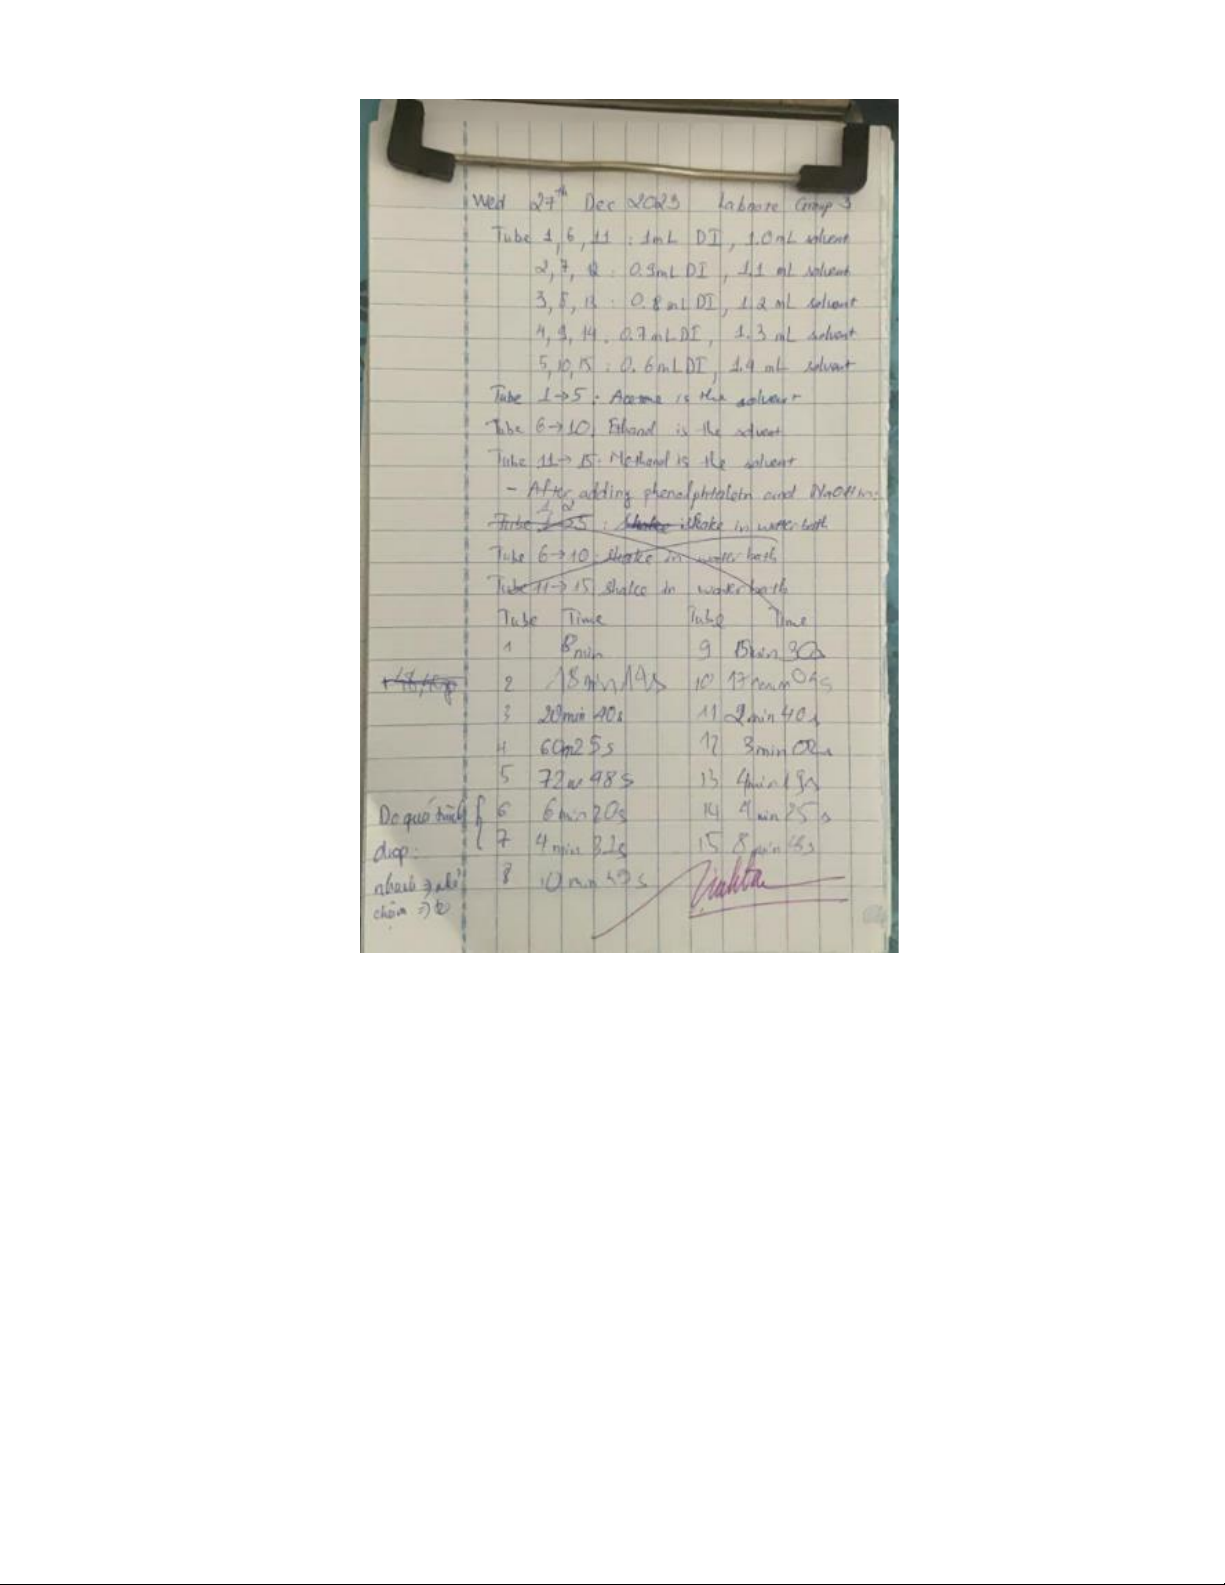
Figure 3: Lab notes 27th Dec 2023. 9
Tài liệu liên quan:
-
Lecture 02: Mole Balance and Reactor Sizing Overview | Môn Chemical Engineering - Trường Đại học Quốc tế, Đại học Quốc gia Thành phố Hồ Chí Minh
108 54 -
A Report - Laboratory experiment 4 : Column chromatography| Bài báo cáo học phần Chemical Engineering | Trường Đại học Quốc tế, Đại học Quốc gia Thành phố Hồ Chí Minh
378 189 -
A Report - Laboratory experiment 3 : Thin Layer Chromatography | Bài báo cáo học phần Chemical Engineering | Trường Đại học Quốc tế, Đại học Quốc gia Thành phố Hồ Chí Minh
292 146 -
A Report - Laboratory experiment 5 : Simple distillation | Bài báo cáo học phần Chemical Engineering | Trường Đại học Quốc tế, Đại học Quốc gia Thành phố Hồ Chí Minh
366 183