Chapter 2: History of Mergers in Finance môn Sáp nhập, mua lại và tái cấu trúc doanh nghiệp | Trường Đại học Kinh tế Thành phố Hồ Chí Minh
Rather, the focus is usually on the latest developments and innovations. This seemsto be particularly the case in the United States, where there is less respect for that which is not new. It is not surprising, then, when we see that many of the mistakes and types of failed deals that occurred in earlier years tend to be repeated. Tài liệu giúp bạn tham khảo, ôn tập và đạt kết quả cao. Mời đọc đón xem!
Môn: Sáp nhập, mua lại và tái cấu trúc doanh nghiệp (MA) 313 tài liệu
Trường: Đại học Kinh tế Thành phố Hồ Chí Minh 2.8 K tài liệu
Tác giả:


Preview text:
CHAPTERTWO HistoryofMergers
INMUCHOFFINANCEthereisverylittleattentionpaidtothehistoryofthefield.
Rather, the focus is usually on the latest developments and innovations. This seems
to be particularly the case in the United States, where there is less respect for that
which is not new. It is not surprising, then, when we see that many of the mistakes and
types of failed deals that occurred in earlier years tend to be repeated. The market seems
to have a short memory, and we see that a pattern of flawed mergers and acquisitions
(M&As) tends to reoccur. It is for this reason that we need to be aware of the history
of the field. Such an awareness will help us identify the types of deals that have been problematic in the past.
There have been many interesting trends in recent M&A history. These include the
fact that M&A has become a worldwide phenomenon as opposed to being mainly cen-
tered in the United States. Other trends include the rise of the emerging market acquirer,
which has brought a very different type of bidder to the takeover scene. We devote special
attention in this chapter to these important trends in recent M&A history. MERGERWAVES
Six periods of high merger activity, often called merger waves, have taken place in
U.S. history. These periods are characterized by cyclic activity—that is, high levels of
mergers followed by periods of relatively fewer deals. The first four waves occurred
between 1897 and 1904, 1916 and 1929, 1965 and 1969, and 1984 and 1989.
Merger activity declined at the end of the 1980s but resumed again in the early 1990s
to begin the fifth merger wave. We also had a relatively short but intense merger period between 2003 and 2007. 41 42 ◾History of Mergers WHAT CAUSES MERGER WAVES?
Research has shown that merger waves tend to be caused by a combination of economic,
regulatory, and technological shocks.1The economic shock comes in the form of an
economic expansion that motivates companies to expand to meet the rapidly growing
aggregate demand in the economy. M&A is a faster form of expansion than internal,
organic growth. Regulatory shocks can occur through the elimination of regulatory
barriers that might have prevented corporate combinations. Examples include the
changes in U.S. banking laws that prevented banks from crossing state lines or entering
other industries. Technological shocks can come in many forms as technological change
can bring about dramatic changes in existing industries and can even create new ones.
Harford shows that these various shocks by themselves are generally not enough to
bring about a merger wave.2He looked at industry waves, rather than the overall level
of M&A activity, over the period 1981–2000. His research on 35 industry waves that
occurred in this period shows that capital liquidity is also a necessary condition for a
wave to take hold. His findings also indicate that misevaluation or market timing efforts
by managers are not a cause of a wave, although they could be a cause in specific deals.
The misevaluation findings, however, are contradicted by Rhodes-Kropf, Robinson, and
Viswanathan, who found that misevaluation and valuation errors do motivate merger
activity.3They measure these by comparing market to book ratios to true valuations.
These authors do not say that valuation errors are the sole factor in explaining merger
waves, but they say that they can play an important role that gains in prominence the
greater the degree of misevaluation.
Rau and Stouraitis have analyzed a sample of 151,000 corporate transactions
over the period 1980–2004, including a broader variety of different corporate events
than just M&As. They have found that “corporate waves” seem to begin with new issue
waves, first starting with seasoned equity offerings and then initial public offerings,
followed by stock-financed M&A and later repurchase waves.4This finding supports
the neoclassical efficiency hypothesis, which suggests that managers will pursue
transactions when they perceive growth opportunities and will engage in repurchases when these opportunities fade. FIRST WAVE, 1897–1904
The first merger wave occurred after the depression of 1883, peaked between 1898
and 1902, and ended in 1904 (Table 2.1). Although these mergers affected all major
mining and manufacturing industries, certain industries clearly demonstrated a higher
1Mark Mitchell and J. H. Mulherin, “The Impact of Industry Shocks on Takeover and Restructuring Activity,”
Journal of Financial Economics 41, no. 2 (June 1996): 193–229.
2Jarrad Harford, “What Drives Merger Waves,” Journal of Financial Economics 77, no. 3 (September 2005): 529–560.
3Matthew Rhodes-Kropf, David T. Robinson, and S. Viswanathan, “Valuation Waves and Merger Activity: The
Empirical Evidence,” Journal of Financial Economics 77, no. 3 (September 2005): 561–603.
4Panambur Raghavendra Rau and Aris Stouraitis, “Patterns in the Timing of Corporate Event Waves,” Journal
of Financial and Quantitative Analysis 46, no. 1 (February 2011): 209–246. First Wave, 1897–1904 ◾43
TABLE 2.1 First Wave, 1897–1904 Year Number of Mergers 1897 69 1898 303 1899 1,208 1900 340 1901 423 1902 379 1903 142 1904 79
Source: Merrill Lynch Business Brokerage and Valuation, Mergerstat Review, 1989.
incidence of merger activity.5According to a National Bureau of Economic Research
study by Professor Ralph Nelson, eight industries—primary metals, food products,
petroleum products, chemicals, transportation equipment, fabricated metal products,
machinery, and bituminous coal—experienced the greatest merger activity. These
industries accounted for approximately two-thirds of all mergers during this period.
The mergers of the first wave were predominantly horizontal combinations (Table 2.2).
The many horizontal mergers and industry consolidations of this era often resulted
in a near monopolistic market structure. For this reason, this merger period is known
for its role in creating large monopolies. This period is also associated with the first
billion-dollar megamerger when U.S. Steel was founded by J. P. Morgan, who combined
Carnegie Steel, founded by Andrew Carnegie and run by Carnegie and Henry Clay
Frick, with Federal Steel, which Morgan controlled. However, Morgan also added other
steel companies, such as American Tin Plate, American Steel Hoop, American Steel
Sheet, American Bridge, American Steel and Wire, International Mercantile Marine,
TABLE 2.2 Mergers by Types, 1895–1904 Type of Merger Percentage (%) Horizontal 78.3 Vertical 12 Horizontal and vertical 9.7 Total 100
Source: Neil Fligstein, The Transformation of Corporate Control (Cambridge, MA: Harvard University Press, 1990), 72.
5Ralph Nelson, Merger Movements in American Industry: 1895–1956 (Princeton, NJ: Princeton University Press, 1959). 44 ◾History of Mergers
National Steel, National Tube, and Shelby Steel Tube. Combined under the corporate
umbrella of U.S. Steel, the company controlled one-half of the U.S. steel industry.6The
resulting steel giant merged 785 separate steel-making operations. At one time, U.S.
Steel accounted for as much as 75% of U.S. steel-making capacity.
Besides U.S. Steel, some of today’s great industrial giants originated in the first
merger wave. These include DuPont, Standard Oil, General Electric, Eastman Kodak,
American Tobacco (merged with Brown and Williamson in 1994, which in turn
merged with RJ Reynolds in 2004), and Navistar International (formerly International
Harvester but became Navistar in 1986 when it sold its agricultural business). While
these companies are major corporations today with large market shares, some were
truly dominant firms by the end of the first merger wave. For example, U.S. Steel was not
the only corporation to dominate its market. American Tobacco enjoyed a 90% market
share, and Standard Oil, owned by J. D. Rockefeller, commanded 85% of its market.
In the first merger movement, there were 300 major combinations covering many
industrial areas and controlling 40% of the nation’s manufacturing capital. Nelson
estimates that in excess of 3,000 companies disappeared during this period as a result of mergers.
By 1909, the 100 largest industrial corporations controlled nearly 18% of the assets
of all industrial corporations. Even the enactment of the Sherman Antitrust Act (1890)
did not impede this period of intense activity. The Justice Department was largely respon-
sible for the limited impact of the Sherman Act. During the period of major consolidation
of the early 1900s, the Justice Department, charged with enforcing the Act, was under-
staffed and unable to aggressively pursue antitrust enforcement. The agency’s activities
were directed more toward labor unions. Therefore, the pace of horizontal mergers
and industry consolidations continued unabated without any meaningful antitrust restrictions.
By the end of the first great merger wave, a marked increase in the degree of con-
centration was evident in U.S. industry. The number of firms in some industries, such as
the steel industry, declined dramatically, and in some sectors only one firm survived. It
is ironic that monopolistic industries formed in light of the passage of the Sherman Act.
However, in addition to the Justice Department’s lack of resources, the courts initially
were unwilling to literally interpret the antimonopoly provisions of the Act. For example,
in 1895, the U.S. Supreme Court ruled that the American Sugar Refining Company was
not a monopoly and did not restrain trade.7At this time, the Supreme Court was not
concerned by the fact that the Sugar Trust controlled 98% of the sugar refining capacity
in the United States. This favorable ruling gave the green light to companies such as
DuPont, Eastman Kodak, General Electric, International Harvester, Standard Oil, and
U.S. Steel to engage in M&As without being concerned about legal interference.8The
courts initially saw the Sherman Act’s focus to be on regulating stockholder trusts,
in which investors would invest funds in a firm and entrust their stock certificates to
directors, who would ensure that they received dividends for their “trust certificates.”
6Ron Chernow, The House of Morgan (New York: Grove Press, 1990).
7Joseph R. Conlin, The American Past (Fort Worth, TX: Harcourt Press, 1997), 500.
8George Stigler, “Monopoly and Oligopoly by Merger,” American Economic Review 40 (May 1950): 23–34. First Wave, 1897–1904 ◾45
With a misguided focus on trusts, the law was not applied to hinder the formation
of monopolies in several industries in the first merger wave. The trusts were formed by
dominant business leaders, such as J. P. Morgan of the House of Morgan and John D.
Rockefeller of Standard Oil and National City Bank, as a response to the poor perfor-
mance of many of the nation’s businesses as they struggled with the weak economic
climate. They saw the structure of many industries, which included many small and
inefficient companies, as part of the reason for this poor performance. They reorganized
failing companies in various industries by forcing shareholders to exchange their equity
in troubled companies for trust certificates in a holding company that would control the
business in question but also many other competitors. With such control, J. P. Morgan
was able to rein in intense competition that he saw was rendering companies in many
industries weak. In doing so he was able to give investors confidence in the soundness
of companies for which he and others were seeking to market securities. His main ini-
tial focus was the railroad industry, which at that time accounted for the majority of
stocks traded on the New York Stock Exchange. Being an industry with large demands
for capital, railroad companies aggressively marketed stocks and bonds through invest-
ment bankers across the United States and Europe. However, railroad companies were
prone to compete aggressively on rates and sought to drive each other to the brink of
bankruptcy. Morgan hated such unrestrained competition and sought to reorganize this
industry, and eventually others, using holding company trusts that would push aside
aggressive competitor managers and replace them with those who would preside over a
more orderly market. Morgan did not consider that consumers would suffer from these
consolidations as his focus was on investors who would seek to benefit.
Trusts grew and came to dominate many industries. Among them were the Ameri-
can Cottonseed Oil Trust and the National Lead Trust, which dominated their respective
industries. Morgan Bank, in turn, controlled First National Bank, the National Bank of
Commerce, the First National Bank of Chicago, Liberty National Bank, Chase National
Bank, Hanover National Bank, and the Astor National Bank.9
In addition to lax enforcement of federal antitrust laws, other legal reasons explain
why the first merger wave thrived. For example, in some states, corporation laws were
gradually relaxed. In particular, corporations became better able to secure capital, hold
stock in other corporations, and expand their lines of business operations, thereby cre-
ating a fertile environment for firms to contemplate mergers. Greater access to capital
made it easier for firms to raise the necessary financing to carry out an acquisition,
and relaxed rules controlling the stockholdings of corporations allowed firms to acquire
stock in other companies with the purpose of acquiring the companies.
Not all states liberalized corporate laws. As a result, the pace of M&As was greater
in some states than in others. New Jersey, in which the passage of the New Jersey
Holding Company Act of 1888 helped liberalize state corporation laws, was the leading
state in M&As, followed by New York and Delaware. The law enabled holding company
trusts to be formed and the State of New Jersey became a mecca for this corporate form.
9Nell Irvin Painter, Standing at Armageddon: The United States, 1877–1919 (New York: Norton, 1987), 178–179. 46 ◾History of Mergers
This Act pressured other states to enact similar legislation rather than see firms move
to reincorporate in New Jersey. Many firms, however, did choose to incorporate in New
Jersey, which explains the wide variety of New Jersey firms that participated in the first
merger wave. This trend declined dramatically by 1915, when the differences in state
corporation laws became less significant.
The development of the U.S. transportation system was another of the major fac-
tors that initiated the first merger wave. Following the Civil War, the establishment of
a major railway system helped create national rather than regional markets that firms
could potentially serve. Transcontinental railroads, such as the Union Pacific–Central
Pacific, which was completed in 1869, linked the western United States with the rest of
the country. Many firms, no longer viewing market potential as being limited by nar-
rowly defined market boundaries, expanded to take advantage of a now broader-based
market. Companies now facing competition from distant rivals chose to merge with local
competitors to maintain their market share. Changes in the national transportation
system made supplying distant markets both easier and less expensive. The cost of rail
freight transportation fell at an average rate of 3.7% per year from 1882 to 1900.10
In the early 1900s, transportation costs increased very little despite a rising demand
for transportation services. It is interesting to note that the ability of U.S. railroads to
continue to cost-effectively ship goods in a global economy impressed Warren Buffett
so much that in 2009 he bid $26.3 billion in cash and stock for the remainder of the
Burlington Northern railroad that he did not already own. Burlington Northern is actu-
ally a product of 390 different railroad M&As over the period 1850–2000.
Several other structural changes helped firms service national markets. For
example, the invention of the Bonsack continuous process cigarette machine enabled
the American Tobacco Company to supply the nation’s cigarette market with a relatively
small number of machines.11 As firms expanded, they exploited economies of scale in
production and distribution. For example, the Standard Oil Trust controlled 40% of the
world’s oil production by using only three refineries. It eliminated unnecessary plants
and thereby achieved greater efficiency.12 A similar process of expansion in the pursuit
of scale economies took place in many manufacturing industries in the U.S. economy
during this time. Companies and their managers began to study the production process
in an effort to enhance their ability to engage in ever-expanding mass production.13
The expansion of the scale of business also required greater managerial skills and led to
further specialization of management.
As mentioned, the first merger wave did not start until 1897, but the first great
takeover battle began much earlier—in 1868. Although the term takeover battle is com-
monly used today to describe the sometimes acerbic conflicts among firms in takeovers, 10 Ibid.
11 Alfred D. Chandler, The Visible Hand: The Managerial Revolution in American Business (Cambridge, MA: Belknap Press, 1977), 249.
12 Alfred D. Chandler, “The Coming of Oligopoly and Its Meaning for Antitrust,” in National Competition Policy:
Historians’ Perspective on Antitrust and Government Business Relationships in the United States (Washington, DC:
Federal Trade Commission, 1981), 72.
13 Robert C. Puth, American Economic History (New York: Dryden Press, 1982), 254. First Wave, 1897–1904 ◾47
it can be more literally applied to the conflicts that occurred in early corporate mergers.
One such takeover contest involved an attempt to take control of the Erie Railroad in
1868. The takeover attempt pitted Cornelius Vanderbilt against Daniel Drew, Jim Fisk,
and Jay Gould. As one of their major takeover defenses, the defenders of the Erie Rail-
road issued themselves large quantities of stock, in what is known as a stock watering
campaign, even though they lacked the authorization to do so.14 At that time, because
bribery of judges and elected officials was common, legal remedies for violating corpo-
rate laws were particularly weak. The battle for control of the railroad took a violent
turn when the target corporation hired guards, equipped with firearms and cannons, to
protect its headquarters. The takeover attempt ended when Vanderbilt abandoned his
assault on the Erie Railroad and turned his attention to weaker targets.
In the late nineteenth century, as a result of such takeover contests, the public
became increasingly concerned about unethical business practices. Corporate laws
were not particularly effective during the 1890s. In response to many anti-railroad
protests, Congress established the Interstate Commerce Commission in 1897. The
Harrison, Cleveland, and McKinley administrations (1889–1901) were all very
pro-business and filled the commission with supporters of the very railroads they were
elected to regulate. Not until the passage of antitrust legislation in the late 1800s and
early 1900s, and tougher securities laws after the Great Depression, did the legal system
attain the necessary power to discourage unethical takeover tactics.
Lacking adequate legal restraints, the banking and business community adopted
its own voluntary code of ethical behavior. This code was enforced by an unwritten
agreement among investment bankers, who agreed to do business only with firms that
adhered to their higher ethical standards. Today Great Britain relies on such a volun-
tary code. Although these informal standards did not preclude all improper activities in
the pursuit of takeovers, they did set the stage for reasonable behavior during the first takeover wave.
Financial factors rather than legal restrictions forced the end of the first merger
wave. First, the shipbuilding trust collapse in the early 1900s brought to the fore the
dangers of fraudulent financing. Second, and most important, the stock market crash
of 1904, followed by the banking Panic of 1907, closed many of the nation’s banks and
ultimately paved the way for the formation of the Federal Reserve System. As a result
of a declining stock market and a weak banking system, the basic financial ingredients
for fueling takeovers were absent. Without these, the first great takeover period came to
a halt. Some economic historians have interpreted the many horizontal combinations
that took place in the first wave as an attempt to achieve economies of scale. Through
M&As, the expanding companies sought to increase their efficiency by lower per-unit
costs. The fact that the majority of these mergers failed implies that these companies
were not successful in their pursuit of enhanced efficiency. Under President Theodore
Roosevelt, whose tenure in the executive office lasted from 1901 to 1909, the antitrust
environment steadily became more stringent. Although he did not play a significant role
14 T. J. Stiles, The First Tycoon: The Epic Life of Cornelius Vanderbilt (New York: Alfred A. Knopf, 2009) 456. 48 ◾History of Mergers
in bringing an end to the first wave, Roosevelt, who came to be known as the trustbuster,
continued to try to exert pressure on anticompetitive activities.
The government was initially unsuccessful in its antitrust lawsuits, but toward the
end of Roosevelt’s term in office it began to realize more success in the courtrooms. The
landmark Supreme Court decision in the 1904 Northern Securities case is an example
of the government’s greater success in bringing antitrust actions. Although President
Roosevelt holds the reputation of being the trustbuster, it was his successor, William
Howard Taft, who succeeded in breaking up some of the major trusts. It is ironic that
many of the companies formed in the breakup of the large trusts became very large busi-
nesses. For example, Standard Oil was broken up into companies such as Standard Oil of
New Jersey, which later became Exxon; Standard Oil of New York, which became Mobil
and merged with Exxon in 1998; Standard Oil of California, which rebranded under the
name Chevron, and acquired Gulf Oil in 1985, Texaco in 2001, and Unocal in 2005;
and Standard Oil of Indiana, which became Amoco, and was acquired by BP in 1998.
The mergers between some of the components of the old Standard Oil reflect the partial
undoing of this breakup as the petroleum market has been global, and these descendants
of J. D. Rockefeller’s old company now face much international competition. SECOND WAVE, 1916–1929
George Stigler, the late Nobel prize–winning economist and former professor at the
University of Chicago, contrasted the first and second merger waves as “merging for
monopoly” versus “merging for oligopoly.” During the second merger wave, several
industries were consolidated. Rather than monopolies, the result was often an oligopolis-
tic industry structure. The consolidation pattern established in the first merger period
continued into the second period. During this second period, the U.S. economy con-
tinued to evolve and develop, primarily because of the post–World War I economic
boom, which provided much investment capital for eagerly waiting securities markets.
The availability of capital, which was fueled by favorable economic conditions and lax
margin requirements, set the stage for the stock market crash of 1929.
The antitrust environment of the 1920s was stricter than the environment that had
prevailed before the first merger wave. By 1910, Congress had become concerned about
the abuses of the market and the power wielded by monopolies. It also had become clear
that the Sherman Act was not an effective deterrent to monopoly. As a result, Congress
passed the Clayton Act in 1914, a law that reinforced the antimonopoly provisions of
the Sherman Act. (For a discussion of the Sherman and Clayton Acts, see Chapter 3.)
As the economy and the banking system rebounded in the late 1900s, this antitrust
law became a somewhat more important deterrent to monopoly. With a more strin-
gent antitrust environment, the second merger wave produced fewer monopolies but
more oligopolies and many vertical mergers. In addition, many companies in unrelated
industries merged. This was the first large-scale formation of conglomerates. However,
although these business combinations involved firms that did not directly produce the
same products, they often had similar product lines. Third Wave, 1965–1969 ◾49
Armed with the Clayton and Sherman Acts, the U.S. government was in a better
position to engage in more effective antitrust enforcement than had occurred during
the first merger wave. Nonetheless, its primary focus remained on cracking down on
unfair business practices and preventing cartels or pools, as opposed to stopping anti-
competitive mergers. At this time widespread price-fixing occurred in many industries,
which was thought to be a more pressing threat to competition than mergers, which
now were mainly vertical or conglomerate transactions. Just as in the first merger wave,
the second merger period witnessed the formation of many prominent corporations that
still operate today. These include General Motors, IBM, John Deere, and Union Carbide. THE 1940S
Before we proceed to a discussion of the third merger period, we will briefly examine
the mergers of the 1940s. During this decade, larger firms acquired smaller, privately
held companies for motives of tax relief. In this period of high estate taxes, the transfer
of businesses within families was very expensive; thus, the incentive to sell out to other
firms arose. These mergers did not result in increased concentration because most of
them did not represent a significant percentage of the total industry’s assets. Most of the
family business combinations involved smaller companies.
The 1940s did not feature any major technological changes or dramatic develop-
ment in the nation’s infrastructure. Thus, the increase in the number of mergers was
relatively small. Nonetheless, their numbers were still a concern to Congress, which
reacted by passing the Celler-Kefauver Act in 1950. This law strengthened Section 7
of the Clayton Act. (For further details on the Clayton Act, see the following section and Chapter 3.) THIRD WAVE, 1965–1969
The third merger wave featured a historically high level of merger activity. This was
brought about in part by a booming economy. During these years, often known as
the conglomerate merger period, it was not uncommon for relatively smaller firms to
target larger companies for acquisition. In contrast, during the two earlier waves, the
majority of the target firms were significantly smaller than the acquiring firms. Peter
Steiner reports that the “acquisition of companies with assets over $100 million, which
averaged only 1.3 per year from 1948 to 1960, and 5 per year from 1961 to 1966,
rose to 24 in 1967, 31 in 1968, 20 in 1969, 12 in 1970 before falling to 5 each year in 1971 and 1972.”15
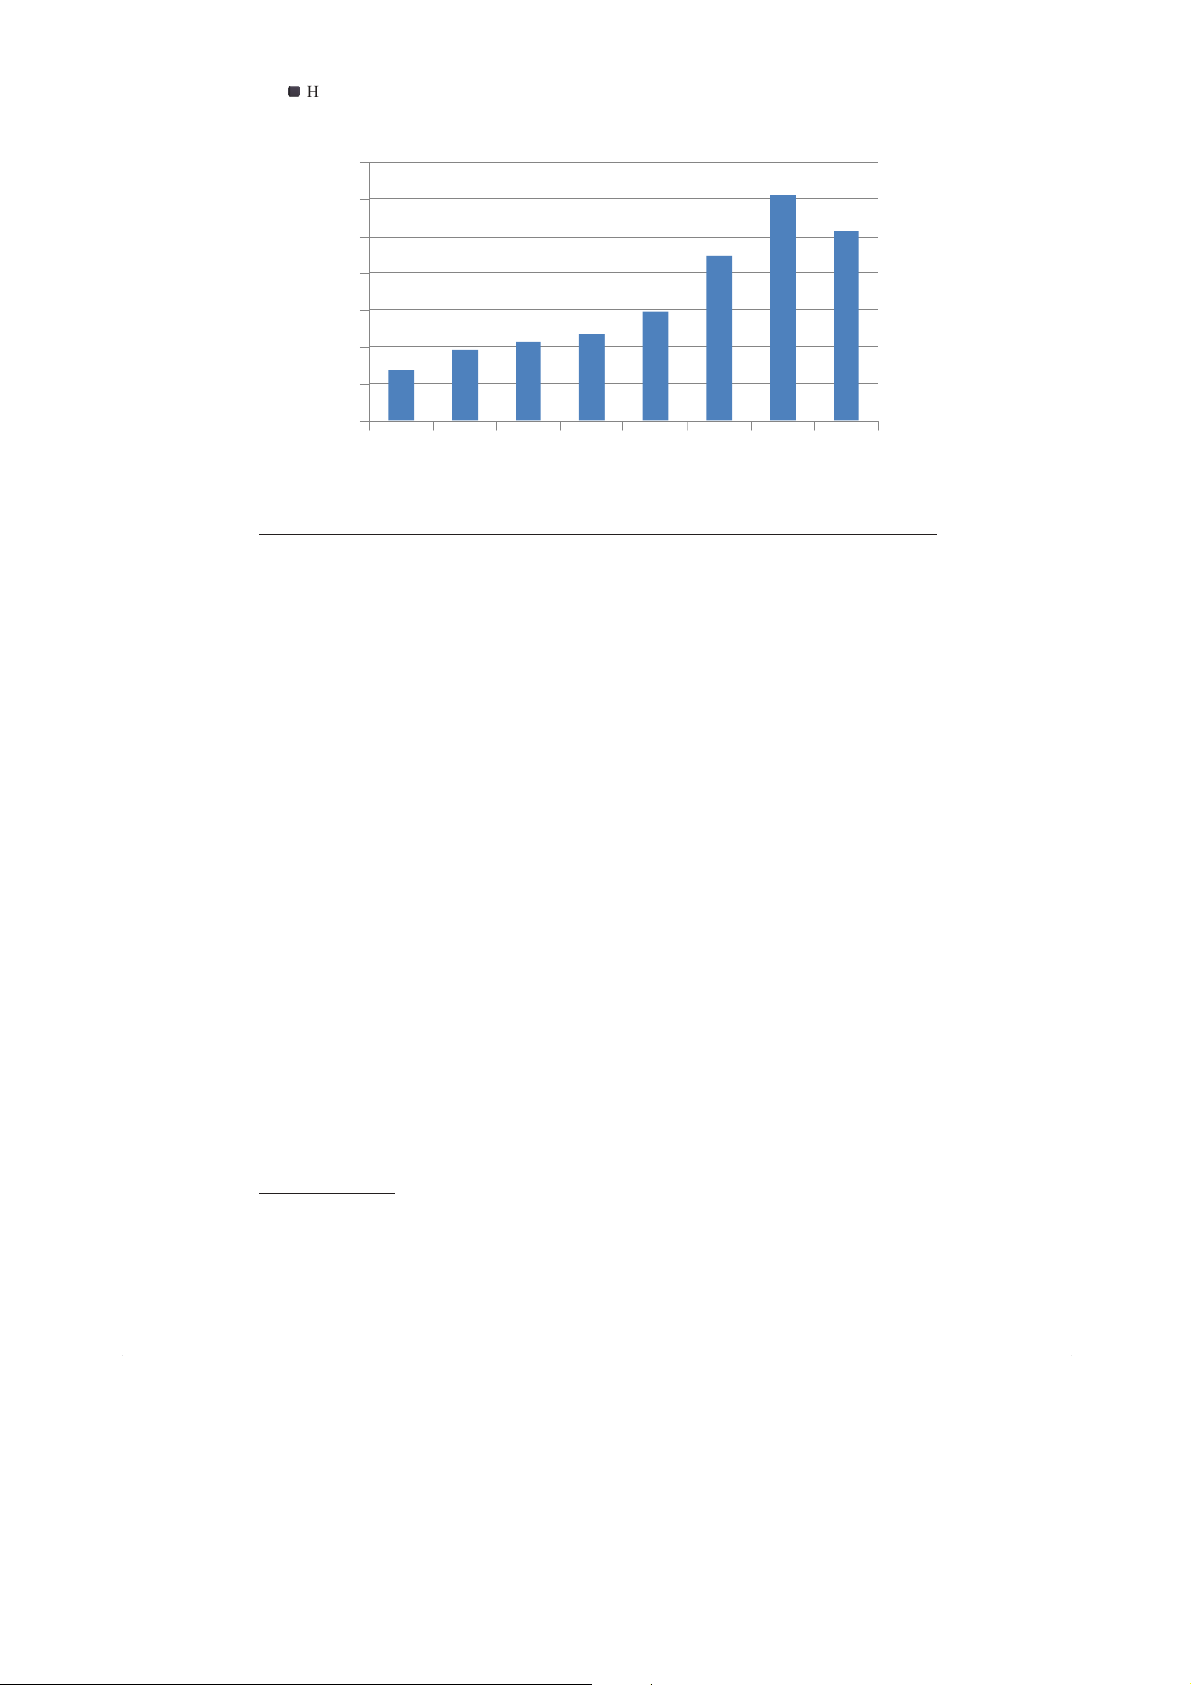
The number of M&As during the 1960s is shown in Figure 2.1. These data were
compiled by W. T. Grimm and Company (now provided by Houlihan Lokey Howard &
Zukin), which began recording M&A announcements on January 1, 1963. As noted, a
15 Peter O. Steiner, Mergers: Motives, Effects and Policies (Ann Arbor: University of Michigan Press, 1975). 50 ◾History of Mergers 7,000 6,000 5,000 4,000 3,000 2,000 1,000 0
1963 1964 1965 1966 1967 1968 1969 1970
FIGURE 2.1 Third Merger Wave, Merger and Acquisition Announcements, 1963–1970.
The Third Merger Wave Peaked in 1969. The Decline in the Stock Market, Coupled with
Tax Reforms, Reduced the Incentive to Merge. Source:Mergerstat Review, 2014.
larger percentage of the M&As that took place in this period were conglomerate transac-
tions. The Federal Trade Commission (FTC) reported that 80% of the mergers that took
place in the 10-year period between 1965 and 1975 were conglomerate mergers.16
The conglomerates formed during this period were more than merely diversified
in their product lines. The term diversified firms is generally applied to companies that
have some subsidiaries in other industries but a majority of their production within one
industry category. Unlike diversified firms, conglomerates conduct a large percentage of
their business activities in different industries. Good examples are Ling-Temco-Vought
(LTV), Litton Industries, and ITT. In the 1960s, ITT acquired such diverse businesses as
Avis Rent A Car, Sheraton Hotels, Continental Baking, and other far-flung enterprises,
such as restaurant chains, consumer credit agencies, home building companies, and
airport parking firms. Although the third merger wave is associated with well-known
conglomerate firms such as ITT and LTV, many corporations of varying sizes engaged
in a diversification strategy. Many small and medium-sized firms also followed this fad
and moved into areas outside their core business.
As firms with the necessary financial resources sought to expand, they faced
tougher antitrust enforcement. The heightened antitrust atmosphere of the 1960s
was an outgrowth of the Celler-Kefauver Act of 1950, which had strengthened
the antimerger provisions of the Clayton Act of 1914. The Clayton Act made the
acquisition of other firms’ stock illegal when the acquisition resulted in a merger that
significantly reduced the degree of competition within an industry. However, the law
had an important loophole: It did not preclude the anticompetitive acquisition of a
firm’s assets. The Celler-Kefauver Act closed this loophole. Armed with tougher laws,
the federal government adopted a stronger antitrust stance, coming down hard on
16 Federal Trade Commission, Statistical Report on Mergers and Acquisitions (Washington, DC, 1977). Third Wave, 1965–1969 ◾51
both horizontal and vertical mergers. Expansion-minded firms found that their only
available alternative was to form conglomerates.
The more intense antitrust enforcement of horizontal mergers was partially
motivated by the political environment of the 1960s. During this decade, Washington
policymakers, emphasizing the potential for abuses of monopoly power, worked through
the FTC and the Justice Department to curb corporate expansion, which created the
potential for monopolistic abuses. Prime advocates of this tougher antitrust enforcement
were Attorney General John Mitchell and Assistant Attorney General Richard McLaren,
the main architect of the federal government’s antitrust efforts during the 1960s. In his
book Managing, Harold Geneen, then chief executive officer of ITT, has described the diffi-
culty his company had in acquiring companies when McLaren was in office.17 McLaren
opposed conglomerate acquisitions based on his fears of “potential reciprocity.” This
would occur, for example, if ITT and its other subsidiaries gave Hartford Insurance, a
company ITT acquired, a competitive edge over other insurance companies. ITT was
forced to compromise its plans to add Hartford to its conglomerate empire. It was able to
proceed with the acquisition only after agreeing to divest itself of other divisions with the
same combined size of Hartford Insurance and to not acquire another large insurance
company for 10 years without prior Justice Department approval. Years later the Euro-
pean Commission would voice similar arguments for opposing takeovers in the 2000s.
With the election of Richard M. Nixon toward the end of the decade, Washington
policymakers advocated a freer market orientation. Nixon supported this policy through
his four appointees to the U.S. Supreme Court, who espoused a broader interpretation of
concepts such as market share. The tough antitrust enforcement of the Justice Depart-
ment came to an end in 1972, as the Supreme Court failed to accept the Justice Depart-
ment’s interpretation of antitrust laws. For example, in some cases the Supreme Court
began to use a broad international market view as opposed to a more narrow domestic
or even regional market definition. Consequently, if as a result of a merger, a firm had a
large percentage of the U.S. market or a region of the nation but a small percentage of the
international market, it could be judged to lack significant monopolistic characteristics.
By this time, however, the third merger wave had already come to an end.
Management Science and Conglomerates
The rapid growth of management science accelerated the conglomerate movement.
Schools of management began to attain widespread acceptability among prominent
schools of higher education, and the master of business administration degree became a
valued credential for the corporate executive. Management science developed method-
ologies that facilitated organizational management and theoretically could be applied
to a wide variety of organizations, including corporations, government, educational
institutions, and even the military. As these management principles gained wider
acceptance, graduates of this movement believed they possessed the broad-based skills
necessary to manage a wide variety of organizational structures. Such managers rea-
sonably believed that they could manage a corporate organization that spanned several
17 Harold Geneen, Managing (New York: Avon, 1989), 228–229. 52 ◾History of Mergers
industry categories. The belief that the conglomerate could become a manageable and
successful corporate entity started to become a reality.
Industry Concentration and the Conglomerate Wave
Because most of the mergers in the third wave involved the formation of conglomerates
rather than vertical or horizontal mergers, they did not appreciably increase industrial
concentration. For this reason, the degree of competition in different industries did not
significantly change despite the large number of mergers. Some 6,000 mergers, entail-
ing the disappearance of 25,000 firms, took place; nonetheless, competition, or market
concentration, in the U.S. economy was not greatly reduced. This clearly contrasts with
the first merger wave, which resulted in a dramatic increase in industry concentration in many industries.
Shareholder Wealth Effects of Diversification during the Conglomerate Wave
In Chapter 4 we critically examine diversification strategies and their impact on share-
holder wealth. However, while we are discussing the conglomerate wave, it is useful to
briefly address some research that has attempted to assess the impact of these types of
deals on shareholder wealth. Henri Servaes analyzed a large sample of firms over the
years 1961–1976.18 He showed that over this time period, the average number of busi-
ness segments in which firms operated increased from 1.74 in 1961 to 2.7 in 1976. He
then examined the Q ratios (ratios of the market value of securities divided by the replace-
ment value of assets) of the companies in his sample and found that diversified firms
were valued at a discount—even during the third merger wave when such diversifying
deals were so popular. He found, however, that this diversification discount declined over
time. Servaes analyzed the assertion that insiders derive private benefits from managing
a diversified firm, which may subject the firm to less risk although at a cost that may not
be in shareholders’ interests. If managers derive private benefits that come at a cost to
shareholders (the discount), then this may explain why companies with higher insider
ownership were focused when the discount was high but began to diversify when the dis-
count declined. At least they did not pursue their private benefits when it was imposing a cost on shareholders.
Some research shows that the stock market response to diversifying acquisitions in
the conglomerate was positive.19 Matsusaka found that not only did the market respond
positively, but also the response was clearly positive when bidders agreed to keep target
management in place and negative when management was replaced as in disciplinary
takeovers. While this may have been the case, this does not mean that the market’s
18 Henri Servaes, “The Value of Diversification during the Conglomerate Wave,” Journal of Finance 51, no. 4 (September 1996): 1201–1225.
19 John G. Matsusaka, “Takeover Motives during the Conglomerate Merger Wave,” RAND Journal of Economics
24, no. 3 (Autumn 1993): 357–379. Third Wave, 1965–1969 ◾53
response in this time period to these diversifying deals was correct. When one considers
the track record of many of these deals, it is easy to conclude that they were flawed. Later
research covering more recent time periods shows that the market may have learned this
lesson, and such deals do not meet with a favorable response.
Price-Earnings Game and the Incentive to Merge
As mentioned previously, investment bankers did not finance most of the mergers in
the 1960s, as they had in the two previous merger waves. Tight credit markets and high
interest rates were the concomitants of the higher credit demands of an expanding econ-
omy. As the demand for loanable funds rose, both the price of these funds and interest
rates increased. In addition, the booming stock market prices provided equity financing
for many of the conglomerate takeovers.
The bull market of the 1960s bid stock prices higher and higher. The Dow Jones
Industrial Average, which was 618 in 1960, rose to 906 in 1968. As their stock
prices skyrocketed, investors were especially interested in growth stocks. Potential bid-
ders soon learned that acquisitions, financed by stocks, could be an excellent “pain-free”
way to raise earnings per share without incurring higher tax liabilities. Mergers
financed through stock transactions may not be taxable. For this reason, stock-financed
acquisitions had an advantage over cash transactions, which were subject to taxation.
Companies played the price-earnings ratio game to justify their expansionist activi-
ties. The price-earnings ratio (P/E ratio) is the ratio of the market price of a firm’s stock
divided by the earnings available to common stockholders on a per-share basis. The
higher the P/E ratio, the more investors are willing to pay for a firm’s stock given their
expectations about the firm’s future earnings. High P/E ratios for the majority of stocks
in the market indicate widespread investor optimism; such was the case in the bull mar-
ket of the 1960s. These high stock values helped finance the third merger wave. Mergers
inspired by P/E ratio effects can be illustrated as follows.
Let us assume that the acquiring firm is larger than the target firm with which it
is considering merging. In addition, assume that the larger firm has a P/E ratio of 25:1
and annual earnings of $1 million, with 1 million shares outstanding. Each share sells
for $25. The target firm has a lower P/E ratio of 10:1 and annual earnings of $100,000,
with 100,000 shares outstanding. This firm’s stock sells for $10. The larger firm offers
the smaller firm a premium on its stock to entice its stockholders to sell. This premium
comes in the form of a stock-for-stock offer in which one share of the larger firm, worth
$25, is offered for two shares of the smaller firm, worth a total of $20. The large firm
issues 50,000 shares to finance the purchase.
This acquisition causes the earnings per share (EPS) of the higher P/E firm to rise.
The EPS of the higher P/E firm has risen from $1.00 to $1.05. We can see the effect on
the price of the larger firm’s stock if we make the crucial assumption that its P/E ratio
stays the same. This implies that the market will continue to value this firm’s future
earnings in a manner similar to the way it did before the acquisition. The validity of this
type of assumption is examined in greater detail in Chapter 14. 54 ◾History of Mergers
Based on the assumption that the P/E ratio of the combined firm remains at 25, the
stock price will rise to $26.25 (25 ×$1.05). We can see that the larger firm can offer the
smaller firm a significant premium while its EPS and stock price rise. This process can
continue with other acquisitions, which also result in further increases in the acquir-
ing company’s stock price. This process will end if the market decides not to apply the
same P/E ratio. A bull market such as occurred in the 1960s helps promote high P/E
values. When the market falls, however, as it did at the end of the 1960s, this process
is not feasible. The process of acquisitions, based on P/E effects, becomes increasingly
untenable as a firm seeks to apply it to successively larger firms. The crucial assumption
in creating the expectation that stock prices will rise is that the P/E ratio of the high P/E
firm will apply to the combined entity. However, as the targets become larger and larger,
the target becomes a more important percentage of the combined firm’s earning power.
After a company acquires several relatively lower P/E firms, the market becomes reluc-
tant to apply the original higher P/E ratio. Therefore, it becomes more difficult to find
target firms that will not decrease the acquirer’s stock price. As the number of suitable
acquisition candidates declines, the merger wave slows down. Therefore, a merger wave
based on such “finance gimmickry” can last only a limited time period before it exhausts itself, as this one did.
With its bull market and the formation of huge conglomerates, the term the go-go
years was applied to the 1960s.20 When the stock market fell in 1969, it affected the
pace of acquisitions by reducing P/E ratios. Figure 2.2 demonstrates how this decline
affected some of the larger conglomerates.
Accounting Manipulations and the Incentive to Merge
Under accounting rules that prevailed at the time, acquirers had the opportunity to
generate paper gains when they acquired companies that had assets on their books that
were well below their market values. The gains were recorded when an acquirer sold
off certain of these assets. To illustrate such an accounting manipulation, A. J. Briloff
recounts how Gulf & Western generated earnings in 1967 by selling off the films of
Paramount Pictures, which it had acquired in 1966.21 The bulk of Paramount’s assets
were in the form of feature films, which it listed on its books at a value significantly less
than their market value. In 1967, Gulf & Western sold 32 of the films of its Paramount
subsidiary. This generated significant “income” for Gulf & Western in 1967, which
succeeded in supporting Gulf & Western’s stock price.
Some believe that these accounting manipulations made fire and casualty insur-
ance companies popular takeover targets during this period.22 Conglomerates found
their large portfolios of undervalued assets to be particularly attractive in light of the
impact of a subsequent sale of these assets on the conglomerate’s future earnings. Even
the very large Hartford Insurance Company, which had assets of nearly $2 billion in
20 John Brooks, The Go-Go Years: The Drama and Crashing Finale of Wall Street’s Bullish 60s (New York: John Wiley & Sons, 1998).
21 A. J. Briloff, “Accounting Practices and the Merger Movement,” Notre Dame Lawyer 45, no. 4 (Summer 1970): 604–628. 22 Steiner, Mergers, 116. Third Wave, 1965–1969 ◾55 50 45.5 High 45 41.6 1970 Value 40 35 30 25 21.6 21.7 20 17.2 15.1 14.4 14.3 13.3 11.3 10.5 15 10 7.6 5 0 Gulf & Western ITT Litton Industries Teledyne Tenneco Textron
FIGURE 2.2 Third Merger Wave, Conglomerate P/E Ratios 1960, 1970. The End of the
Third Merger Wave Was Signaled by the Dramatic Decline in the P/E Ratios of Some of
That Era’s Leading Conglomerates. Source: Peter O. Steiner, Mergers: Motives, Effects
and Policies (Ann Arbor: University of Michigan Press, 1975), 104.
1968 (approximately $13.9 billion in 2014 dollars), had assets that were clearly under-
valued. ITT capitalized on this undervaluation when it acquired Hartford Insurance.
Another artificial incentive that encouraged conglomerate acquisitions involved
securities, such as convertible debentures, which were used to finance acquisitions.
Acquiring firms would issue convertible debentures in exchange for common stock
of the target firm. This allowed them to receive the short-term benefit of adding the
target’s earnings to its EPS valuation while putting off the eventual increase in the
acquirer’s shares outstanding.
Decline of the Third Merger Wave
The decline of the conglomerates may be first traced to the announcement by Litton
Industries in 1968 that its quarterly earnings declined for the first time in 14 years.23
Although Litton’s earnings were still positive, the market turned sour on conglomerates,
and the selling pressure on their stock prices increased.
In 1968, Attorney General Richard McLaren announced that he intended to crack
down on the conglomerates, which he believed were an anticompetitive influence on
the market. Various legal changes were implemented to limit the use of convertible debt
to finance acquisitions. The 1969 Tax Reform Act required that convertible debt be
treated as equity for EPS calculations while also restricting changes in the valuation of
undervalued assets of targets. The conglomerate boom came to an end, and this helped collapse the stock market.
23 Stanley H. Brown, Ling: The Rise, Fall and Return of a Texas Titan (New York: Atheneum, 1972), 166. 56 ◾History of Mergers Performance of Conglomerates
Little evidence exists to support the advisability of many of the conglomerate acqui-
sitions. Buyers often overpaid for the diverse companies they purchased. Many of the
acquisitions were followed by poor financial performance. This is confirmed by the fact
that 60% of the cross-industry acquisitions that occurred between 1970 and 1982 were sold or divested by 1989.
There is no conclusive explanation for why conglomerates failed. Economic
theory, however, points out the productivity-enhancing effects of increased specializa-
tion. Indeed, this has been the history of capitalism since the Industrial Revolution.
The conglomerate era represented a movement away from specialization. Managers of
diverse enterprises often had little detailed knowledge of the specific industries that were
under their control. This is particularly the case when compared with the management
expertise and attention that are applied by managers who concentrate on one industry
or even one segment of an industry. It is not surprising, therefore, that companies like
Revlon, a firm that has an established track record of success in the cosmetics industry,
saw its core cosmetics business suffer when it diversified into unrelated areas, such as health care.
TRENDSETTING MERGERS OF THE 1970S
The number of M&A announcements in the 1970s fell dramatically, as shown
in Figure 2.3. Even so, the decade played a major role in merger history. Several
path-breaking mergers changed what was considered to be acceptable takeover behavior
in the years to follow. The first of these mergers was the International Nickel Company
(INCO) acquisition of ESB (formerly known as Electric Storage Battery Company). INCO versus ESB
After the third merger wave, a historic merger paved the way for a type that would be
pervasive in the fourth wave: the hostile takeover by major established companies. 7,000 6,000 5,000 4,000 3,000 2,000 1,000 0
1969 1970 1971 1972 1973 1974 1975 1976 1977 1978 1979 1980
FIGURE 2.3 Merger and Acquisition Announcements, 1969–1980. Source: Mergerstat Review, 2014.
Trendsetting Mergers of the 1970s ◾57
In 1974, Philadelphia-based ESB was the largest battery maker in the world,
specializing in automobile batteries under the Willard and Exide brand names as well
as other consumer batteries under the Ray-O-Vac brand name. Although the firm’s
profits had been rising, its stock price had fallen in response to a generally declining
stock market. Several companies had expressed an interest in acquiring ESB, but
all these efforts were rebuffed. On July 18, 1974, INCO announced a tender offer to
acquire all outstanding shares of ESB for $28 per share, for a total of $157 million. The
Toronto-based INCO controlled approximately 40% of the world’s nickel market and was
by far the largest firm in this industry. Competition in the nickel industry had increased
in the previous 10 years while demand proved to be increasingly volatile. In an effort to
smooth their cash flows, INCO sought an acquisition target that was less cyclical.
INCO ultimately selected ESB as the appropriate target for several reasons. As part
of what INCO considered to be the “energy industry,” ESB was attractive in light of
the high oil prices that prevailed at that time. While it featured name brands, ESB was
also not in the forefront of innovation and was losing ground to competitors, such as Eveready and Duracell.
Because the takeover was an unfriendly acquisition, INCO did not have the benefit of
a detailed financial analysis using internal data. Before INCO acquired ESB, major rep-
utable corporations did not participate in unfriendly takeovers; only smaller firms and
less respected speculators engaged in such activity. If a major firm’s takeover overtures
were rebuffed, the acquisition was discontinued. Moreover, most large investment banks
refused to finance hostile takeovers.
At this time, the level of competition that existed in investment banking was putting
pressure on the profits of Morgan Stanley, INCO’s investment banker. Although it was
seeking additional sources of profits, Morgan Stanley was also concerned that by refus-
ing to aid INCO in its bid for ESB, it might lose a long-term client. Morgan Stanley, long
known as a conservative investment bank, reluctantly began to change posture as it
saw its market share erode because of the increasingly aggressive advance of its rivals in
the investment banking business. Underwriting, which had constituted 95% of its busi-
ness until 1965, had become less profitable as other investment banks challenged the
traditional relationships of the underwriting business by making competitive bids when
securities were being underwritten.24
Many banks, seeking other areas of profitability, expanded their trading operations.
By the 1980s, trading would displace underwriting as the investment bank’s key profit
center.25 This situation would change once again toward the end of the 1980s as fees
related to M&As became an increasingly important part of some investment banks’ revenues.
24 John Brooks, The Takeover Game (New York: Dutton, 1987), 4.
25 Ken Auletta, Greed and Glory on Wall Street: The Fall of the House of Lehman (New York: Random House,
1986). Auletta provides a good discussion of how the traders, led by Lewis Glucksman, usurped the power of
the investment bankers, led by Pete Peterson, and forced Peterson out of the firm. Peterson, however, went on
to thrive as one of the founders of the very successful Blackstone private equity firm. For a good discussion
of how Glucksman’s protégé and successor, Richard Fuld, ended up leading Lehman Brothers right into the
largest bankruptcy in history, see Lawrence G. McDonald and Patrick Robinson, A Colossal Failure of Common
Sense: The Insider Story of the Collapse of Lehman Brothers (New York: Crown Business, 2009). 58 ◾History of Mergers
ESB found itself unprepared for a hostile takeover, given the novelty of this type
of action. INCO gave it only a three-hour warning of its “take it or leave it.” ESB had
installed some antitakeover defenses, but they were ineffective. It sought help from the
investment bank of Goldman Sachs, which tried to arrange a friendly takeover by United
Aircraft, but by September 1974, INCO’s hostile takeover of ESB was completed.26 The
takeover of ESB proved to be a poor investment, primarily because INCO, as a result of
legal actions associated with antitrust considerations, was not given a free hand to man-
age the company. Not until 39 months after INCO had completed the acquisition did it
attain the right to exercise free control over the company. Moreover, as noted previously,
ESB’s competitors were already aggressively marketing superior products. By 1981,
ESB was reporting operating losses; INCO eventually sold it in four separate parts. INCO
continued to be the world leader in the nickel business. Interestingly, it stepped into the
role of white knight in 2006, when it made a bid for Canadian Falconbridge, a leading
copper, nickel, and zinc producer, which was the target of an unwanted 2005 bid
from the Swiss mining company Xstrata. This led to a long and complicated takeover
battle involving several companies. Eventually, INCO was acquired for approximately
$17 billion by the world’s largest producer of iron ore, Brazilian company CVRD.
Although the ESB acquisition was not financially successful, it was precedent-
setting. It set the stage for hostile takeovers by respected companies in the second
half of the 1970s and through the fourth merger wave of the 1980s. This previously
unacceptable action—the hostile takeover by a major industrial firm with the support
of a leading investment banker—now gained legitimacy. The word hostile now became
part of the vocabulary of M&As. “‘ESB is aware that a hostile tender offer is being made
by a foreign company for all of ESB’s shares,’ said F. J. Port, ESB’s president. ‘Hostile’
thus entered the mergers and acquisitions lexicon.”27
While the Inco-ESB deal was precedent setting in the U.S. market as it was the first
hostile takeover by a major corporation and supported by a major investment bank, it
was not the first hostile takeover. As we have already noted, such deals were attempted
in the United States in the 1800s. In Europe, the first major hostile deal appears to be the
1956 takeover of British Aluminum by Reynolds Metal and Tube Investments. This deal,
known as the “aluminum war,” was engineered by the then up-and-coming investment bank S. G. Warburg.28
United Technologies versus Otis Elevator
As suggested previously, following INCO’s hostile takeover of ESB, other major corpo-
rations began to consider unfriendly acquisitions. Firms and their chief executives who
26 For an excellent discussion of this merger, see Jeff Madrick, Taking America (New York: Bantam Books, 1987), 1–59.
27 “Hostility Breeds Contempt in Takeovers, 1974,” Wall Street Journal, October 25, 1989.
28 Niall Ferguson, High Financier: The Lives and Times of Siegmund Warburg (New York: Penguin Press, 2010), 183–199.
Trendsetting Mergers of the 1970s ◾59
were inclined to be raiders but inhibited by censure from the business community now
became unrestrained. United Technologies was one such firm.
In 1975, United Technologies had recently changed its name from United Aircraft
through the efforts of its chairman, Harry Gray, and president, Edward Hennessy, who
were transforming the company into a growing conglomerate. They were familiar with
the INCO-ESB acquisition, having participated in the bidding war for ESB as the unsuc-
cessful white knight that Goldman Sachs had solicited on ESB’s behalf. Up until the bid
for Otis, United had never participated in a hostile acquisition.
At that time the growth of the elevator manufacturing business was slowing down
and its sales patterns were cyclical inasmuch as it was heavily dependent on the con-
struction industry. Nonetheless, this target was extremely attractive. One-third of Otis’s
revenues came from servicing elevators, revenues that tend to be much more stable than
those from elevator construction. That Otis was a well-managed company made it all
the more appealing to United Technologies. Moreover, 60% of Otis’s revenues were from
international customers, a detail that fit well with United Technologies’ plans to increase
its international presence. By buying Otis Elevator, United could diversify internation-
ally while buying an American firm and not assuming the normal risk that would be
present with the acquisition of a foreign company.
United initially attempted friendly overtures toward Otis, which were not accepted.
On October 15, 1975, United Technologies bid $42 per share for a controlling interest
in Otis Elevator, an offer that precipitated a heated battle between the two firms. Otis
sought the aid of a white knight, the Dana Corporation, an auto parts supplier, while
filing several lawsuits to enjoin United from completing its takeover. A bidding war that
ensued between United Technologies and the Dana Corporation ended with United win-
ning with a bid of $44 per share. Unlike the INCO-ESB takeover, however, the takeover of
Otis proved to be an excellent investment of United’s excess cash. Otis went on to enjoy
greater-than-expected success, particularly in international markets.
United’s takeover of Otis was a ground-breaking acquisition; not only was it a hostile
takeover by an established firm, but also it was a successful venture and Otis remains a
valuable part of United today. This deal helped make hostile takeovers acceptable.
Colt Industries versus Garlock Industries
Colt Industries’ takeover of Garlock Industries was yet another precedent-setting
acquisition, moving hostile takeovers to a sharply higher level of hostility. The other
two hostile takeovers by major firms had amounted to heated bidding wars but were
mild in comparison to the aggressive tactics used in this takeover.
In 1964, the Fairbanks Whitney Company changed its name to Colt Industries,
which was the firearms company it had acquired in 1955. During the 1970s, the com-
pany was almost totally restructured, with Chairman George Strichman and President
David Margolis divesting the firm of many of its poorly performing businesses. The
management wanted to use the cash from these sales to acquire higher-growth indus-
trial businesses. As part of this acquisition program, in 1975, Colt initiated a hostile bid
for Garlock Industries, which manufactured packing and sealing products. The deal
was path-breaking due to the fact that Garlock fought back furiously and aggressively 60 ◾History of Mergers
by using public relations as part of its defensive arsenal. Colt responded in kind and
eventually acquired Garlock. This deal is notable for making hostile deals truly hostile.
Such deals are commonplace today. LING-TEMCO-VOUGHT: GROWTH OF A CONGLOMERATE𝐚
Ltinheg-tThiermdcom-eVrgoeurghwta(vLe.TVTh)eCcoorpmopraantiyonwwasalseodnbeyoJfathmeesleJaodsienpghcLoinngglo—mtheeratLeisngof
of Ling-Temco-Vought. The story of how he parlayed a $2,000 investment and a
small electronics business into the fourteenth-largest industrial company in the
United States is a fascinating one. Ling-Temco-Vought was a sprawling industrial
corporation, which at its peak included such major enterprises as Jones & Laughlin
Steel, the nation’s sixth-largest steel company; Wilson & Co., a major meat packing
and sporting goods company; Braniff Airways, an airline that serviced many domestic
and international routes; Temco and Vought Aircraft, both suppliers of aircraft for
the military; and several other companies. The company originated in a small Texas
electrical contracting business that Jimmy Ling grew, through a pattern of diverse
acquisitions, into one of the largest U.S. corporations. The original corporate entity,
the Ling Electric Company, was started in 1947 with a modest investment of $2,000,
which was used to buy war surplus electrical equipment and a used truck. By
1956, Ling Electronics had enjoyed steady growth and embarked on one of its
first acquisitions by buying L. M. Electronics. Various other electronic and defense
contractors were then acquired, including the American Microwave Corporation,
the United Electronics Company, and the Calidyne Company. Acquisitions such as
these—companies that lacked the requisite capital to expand—were financed by
Ling through a combination of debt and stock in his company, which traded on the over-the-counter market.
By 1958, this master dealmaker sold an offering of convertible debentures in a
private placement that was arranged by the Wall Street investment bank of White
Weld & Company. This type of securities offering was particularly popular with the
dealmakers of the third wave because it did not have an immediate adverse impact
on earnings per share, thus leaving the company in a good position to play the
“profits/earnings game.” With its stock price trading in the $40s, Ling started the
process of buying targets that were much bigger than the acquiring company with
the 1958 stock-for-stock acquisition of Altec Companies, a manufacturer of sound systems.
After some other small acquisitions, Ling initiated his largest acquisition when
he merged his company with the Texas Engineering and Manufacturing Company,
Temco. This deal enabled Ling to accomplish a long-term goal when the merged
company, Ling-Temco Electronics, became part of the Fortune 500. Shortly there-
after, Ling prevailed in a hostile takeover of the Vought Aircraft Company to form Ling-Temco-Vought.
Ling-Temco-Vought went through a period of lackluster financial performance,
which forced Ling to restructure the company by selling off poorly performing divi-
sions. In 1967, Ling successfully completed a tender offer for Wilson & Company, a
firm twice the size of LTV. This deal vaulted LTV to number 38 on the Fortune 500 list.
Wilson was composed of three subsidiaries: Wilson & Company, the meat-packing
Tài liệu liên quan:
-
Essential Cheat Sheet for Mergers & Acquisitions Basics môn Sáp nhập, mua lại và tái cấu trúc doanh nghiệp | Trường Đại học Kinh tế Thành phố Hồ Chí Minh
10 5 -
Phân Tích Tình Hình Tài Chính và Chiến Lược CEC môn Sáp nhập, mua lại và tái cấu trúc doanh nghiệp | Trường Đại học Kinh tế Thành phố Hồ Chí Minh
12 6 -
Nghiên cứu Tình Huống M&A: Phân Tích Thương Vụ Sony-Columbia - BTTG môn Sáp nhập, mua lại và tái cấu trúc doanh nghiệp | Trường Đại học Kinh tế Thành phố Hồ Chí Minh
14 7 -
Đề cương chi tiết về Thoái Vốn và Bán Công Ty môn Sáp nhập, mua lại và tái cấu trúc doanh nghiệp | Trường Đại học Kinh tế Thành phố Hồ Chí Minh
11 6 -
Chương 11: Tái cấu trúc Doanh Nghiệp trong M&A | Tiểu luận môn Sáp nhập, mua lại và tái cấu trúc doanh nghiệp | Trường Đại học Kinh tế Thành phố Hồ Chí Minh
10 5