Chương 1: Giới thiệu về Hợp nhất và Sáp nhập trong M&A môn Sáp nhập, mua lại và tái cấu trúc doanh nghiệp | Trường Đại học Kinh tế Thành phố Hồ Chí Minh
Trong làn sóng sáp nhập thứ năm (những năm 1990), đã có sự tăng trưởng đáng kể về khối·lượng các thương vụ ở Châu Âu.Khối lượng các thương vụ ở Châu Âu và Mỹ tương đương nhau.·Trong làn sóng thứ tư (những năm 1980), hoạt động sáp nhập và mua lại (M&A) chủ yếu·diễn ra ở Mỹ. Tài liệu giúp bạn tham khảo, ôn tập và đạt kết quả cao. Mời đọc đón xem!
Môn: Sáp nhập, mua lại và tái cấu trúc doanh nghiệp (MA) 313 tài liệu
Trường: Đại học Kinh tế Thành phố Hồ Chí Minh 2.8 K tài liệu
Tác giả:


Preview text:
BỘ GIÁO DỤC VÀ ĐÀO TẠO ĐẠI HỌC UEH TRƯỜNG KINH DOANH UEH KHOA TÀI CHÍNH
MÔN: HỢP NHẤT, SÁP NHẤT VÀ CẤU TRÚC DOANH NGHIỆP
BẢN DỊCH SLIDE CHƯƠNG 1: GIỚI THIỆU
SÁCH MERGER ACQUISITIONS AND CORPORATE 6th EDITION
GIẢNG VIÊN: TS. Nguyễn Thị Uyên Uyên
Lớp học phần: 24C1FIN50509004 Nhóm thực hiện: Nhóm 1 à tên MSSV SĐT Email
ng Kiên 31221026590 0917519256 kienphan.31221026590@st.ueh.ed Quyền 31221025127 0944617357
quyenle.31221025127@st.ueh.edu.v Thông 31221022111 0919991006 thongvo.31221022111@st.ueh.ed ường Vy 31211021479 0789754495 vynguyen.31211021479@st.ueh.ed
Thành phố Hồ Chí Minh, thán Chương 1: Giới thiệu
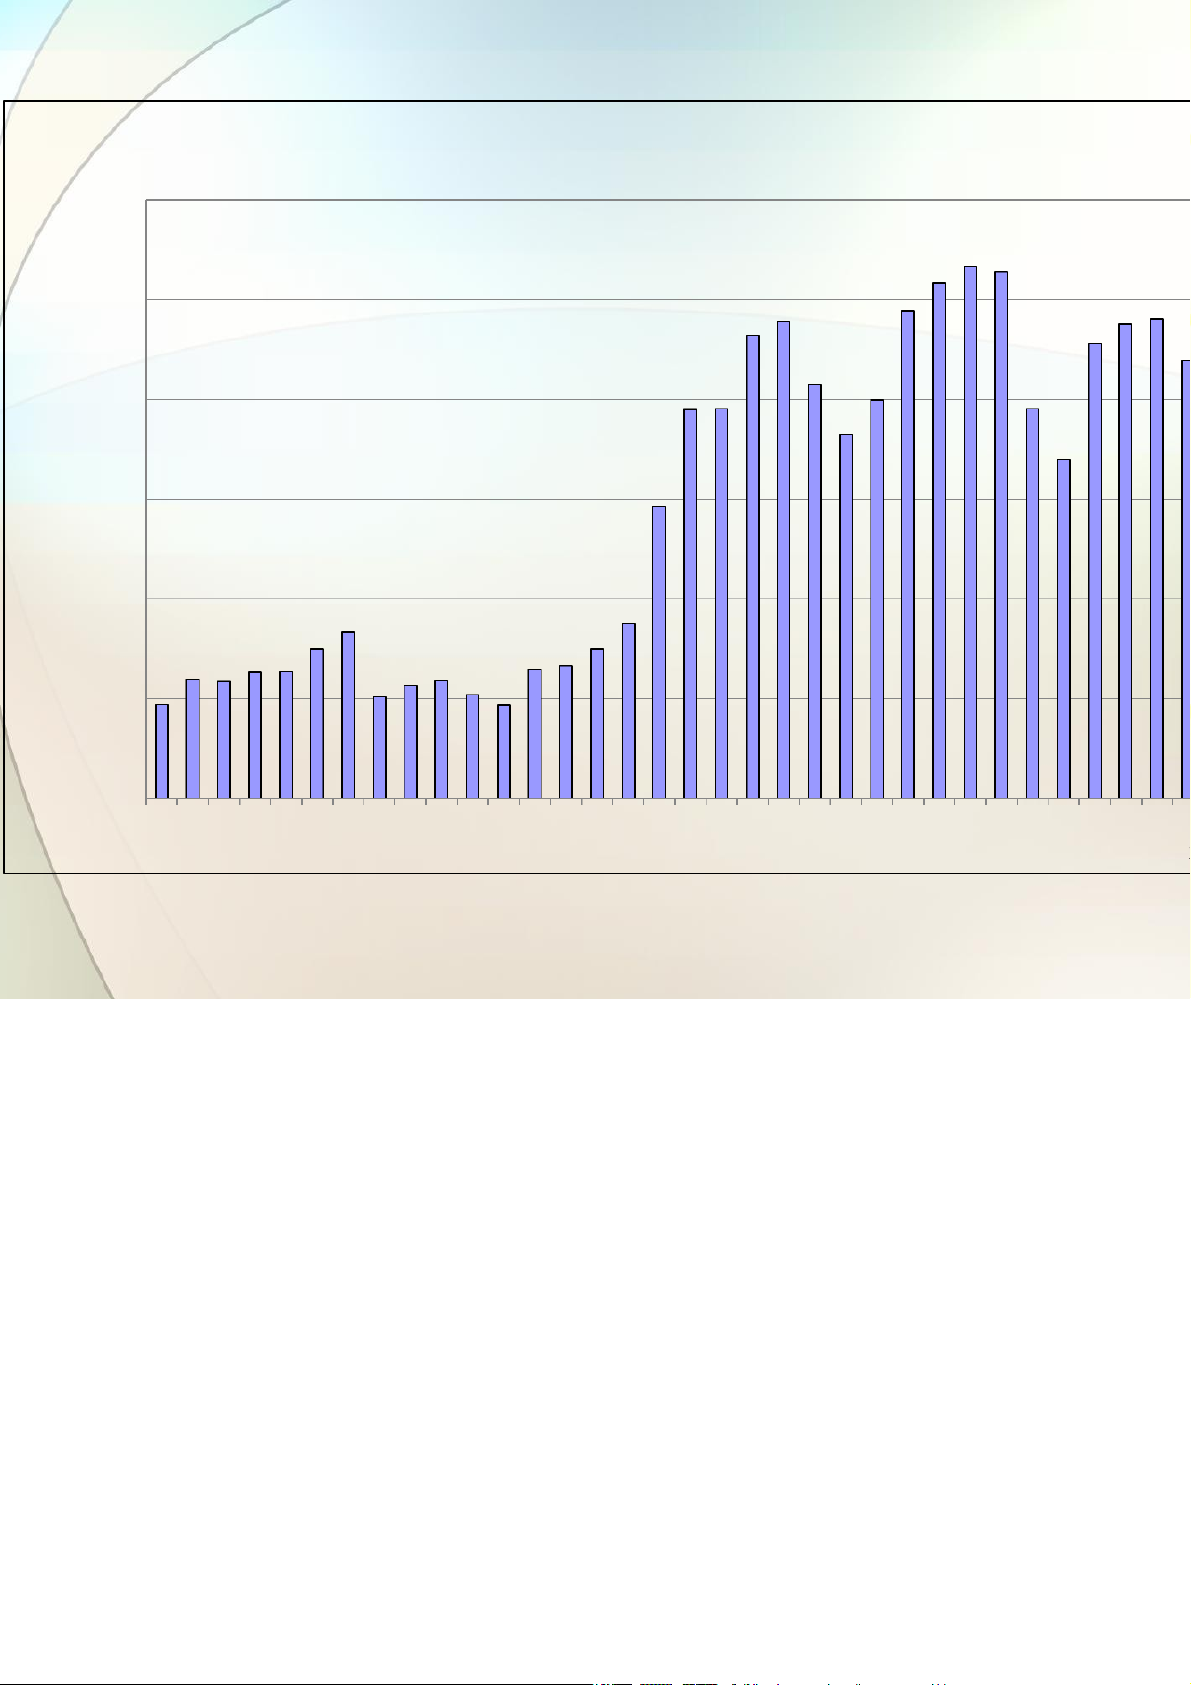
Các thông báo M&A 1980-2013 12,000 10,000 8,000 6,000 Number 4,000 2,000 0 1980 19819821983 1984 1985 1986 1987 1988 1989 1990 1991992 1993 1994 1995 1996 1997 1998 1999 2000 2001 2002003 2004 2005 2006 2007 2008 2009 2010 2011 2012 urce: Mergerstat Review, 2014
All Rights Reserved. © May not be reproduced, copied, or otherwise used without the express, written permission of Dr. Patrick Gaughan
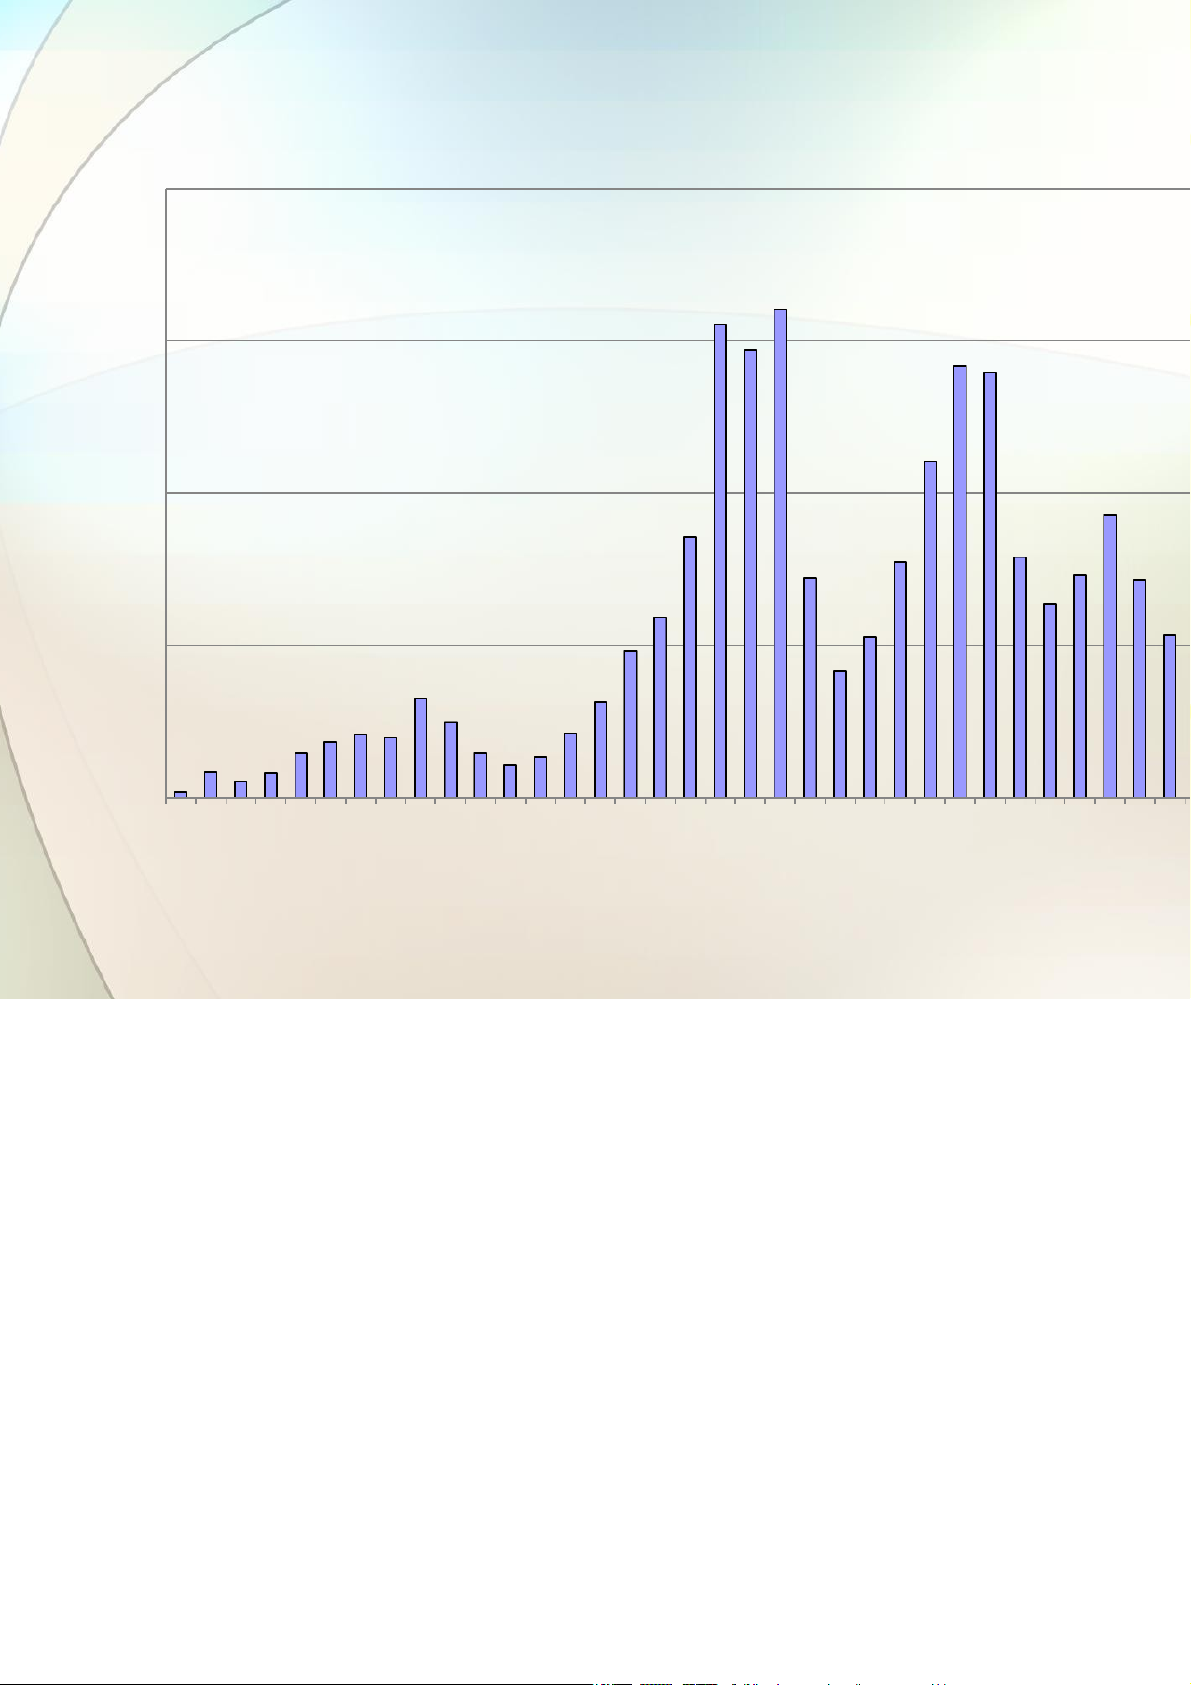
Gía trị U.S. M&A: 1980-2014 2,000,000 1,500,000 1,000,000 $ Millions 500,000 0
1980 1982 1984 1986 1988 1990 1992 1994 1996 1998 2000 2002 2004 2006 2008 2010 2012
ource: Thomson Financial Securities Data.
All Rights Reserved. © May not be reproduced, copied, or otherwise used without the express, written permission of Dr. Patrick Gaughan
Mười Thương Vụ Mua Bán và Sáp Nhập Lớn Nhất Toàn Cầu.
Top 10 Worldwide M&As by Value of Transaction Value of Date Date Target Name Target Nation Acquirer Name Acquirer Transaction nounced Effective Nation ($ Millions) /14/1999 6/19/2000 202,785.13 Mannesmann AG Germany Vodafone AirTouch PLC United Kingdom 10/2000 1/12/2001 164,746.86 Time Warner United States America Online Inc United States /2/2013 2/21/2014 130,298.32 Verizon Wireless Inc United States Verizon Communications Inc United States 29/2007 3/28/2008 107,649.95 Philip Morris Intl Inc Switzerland Shareholders Switzerland 25/2007 11/2/2007 98,189.19 ABN-AMRO Holding NV Netherlands RFS Holdings BV Netherlands 1/4/1999 6/19/2000 89,167.72 Warner-Lambert Co United States Pfizer Inc United States 2/1/1998 11/30/1999 78,945.79 Mobil Corp United States Exxon Corp United States 17/2000 12/27/2000 75,960.85 SmithKline Beecham PLC United Kingdom Glaxo Wellcome PLC United Kingdom /28/2004 8/9/2005 74,558.58 Shell Transport & Trading Co United Kingdom Royal Dutch Petroleum Co Netherlands /5/2006 12/29/2006 72,671.00 BellSouth Corp United States AT&T Inc United States
Source: Thomson Financial Securities Data
All Rights Reserved. © May not be reproduced, copied, or otherwise used without the express, written permission of Dr. Patrick Gaughan
Mức độ chênh lệch trung bình được trả trong các giao dịch M&A 70% 1990-2013 60% 50% 40% 30% 20% 10% 0% 1978
197919801981982198319841985198619871988 19891990199199219931994
19951996199719981999200020012002003 2004 200520062007200820092010201120
Source: Mergerstat Review, 2014
All Rights Reserved. © May not be reproduced, copied, or otherwise used without the express, written permission of Dr. Patrick Gaughan
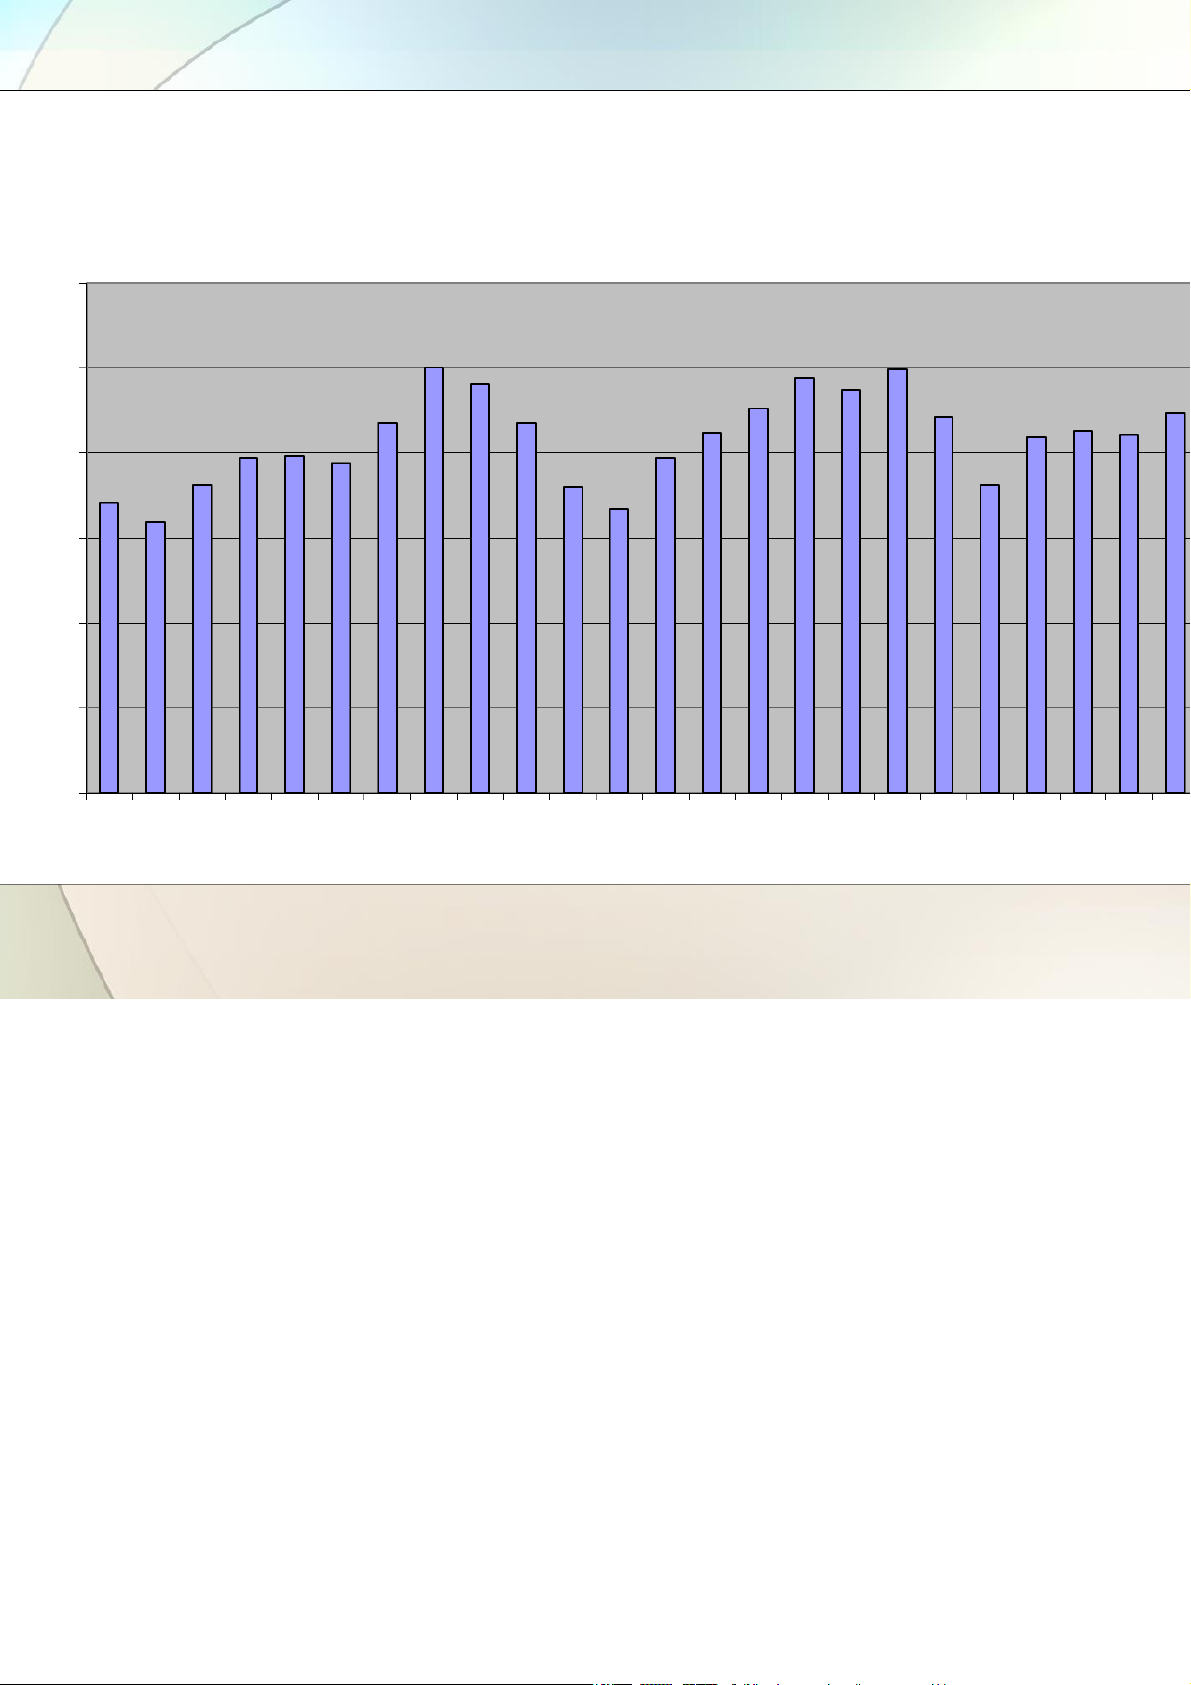
Tỷ số P/E trung bình được đề xuất trong các
giao dịch M&A (1990 – 2013) 30 25 20 15 10 5 0
90 91 92 93 94 95 96 97 98 99 00 01 02 03 04 05 06 07 08 09 10 11 12 13
Source: Mergerstat Review, 2014
All Rights Reserved. © May not be reproduced, copied, or otherwise used without the express, written permission of Dr. Patrick Gaughan
Sự Tăng Trưởng về Khối Lượng Thương Vụ tại Châu Âu
Trong làn sóng sáp nhập thứ năm (những năm 1990), đã có sự tăng trưởng đáng kể về
lượng các thương vụ ở Châu Âu.
Khối lượng các thương vụ ở Châu Âu và Mỹ tương đương nhau.
Trong làn sóng thứ tư (những năm 1980), hoạt động sáp nhập và mua lại (M&A) chủ diễn ra ở Mỹ.
All Rights Reserved. © May not be reproduced, copied, or otherwise used without the express, written permission of Dr. Patrick Gaughan
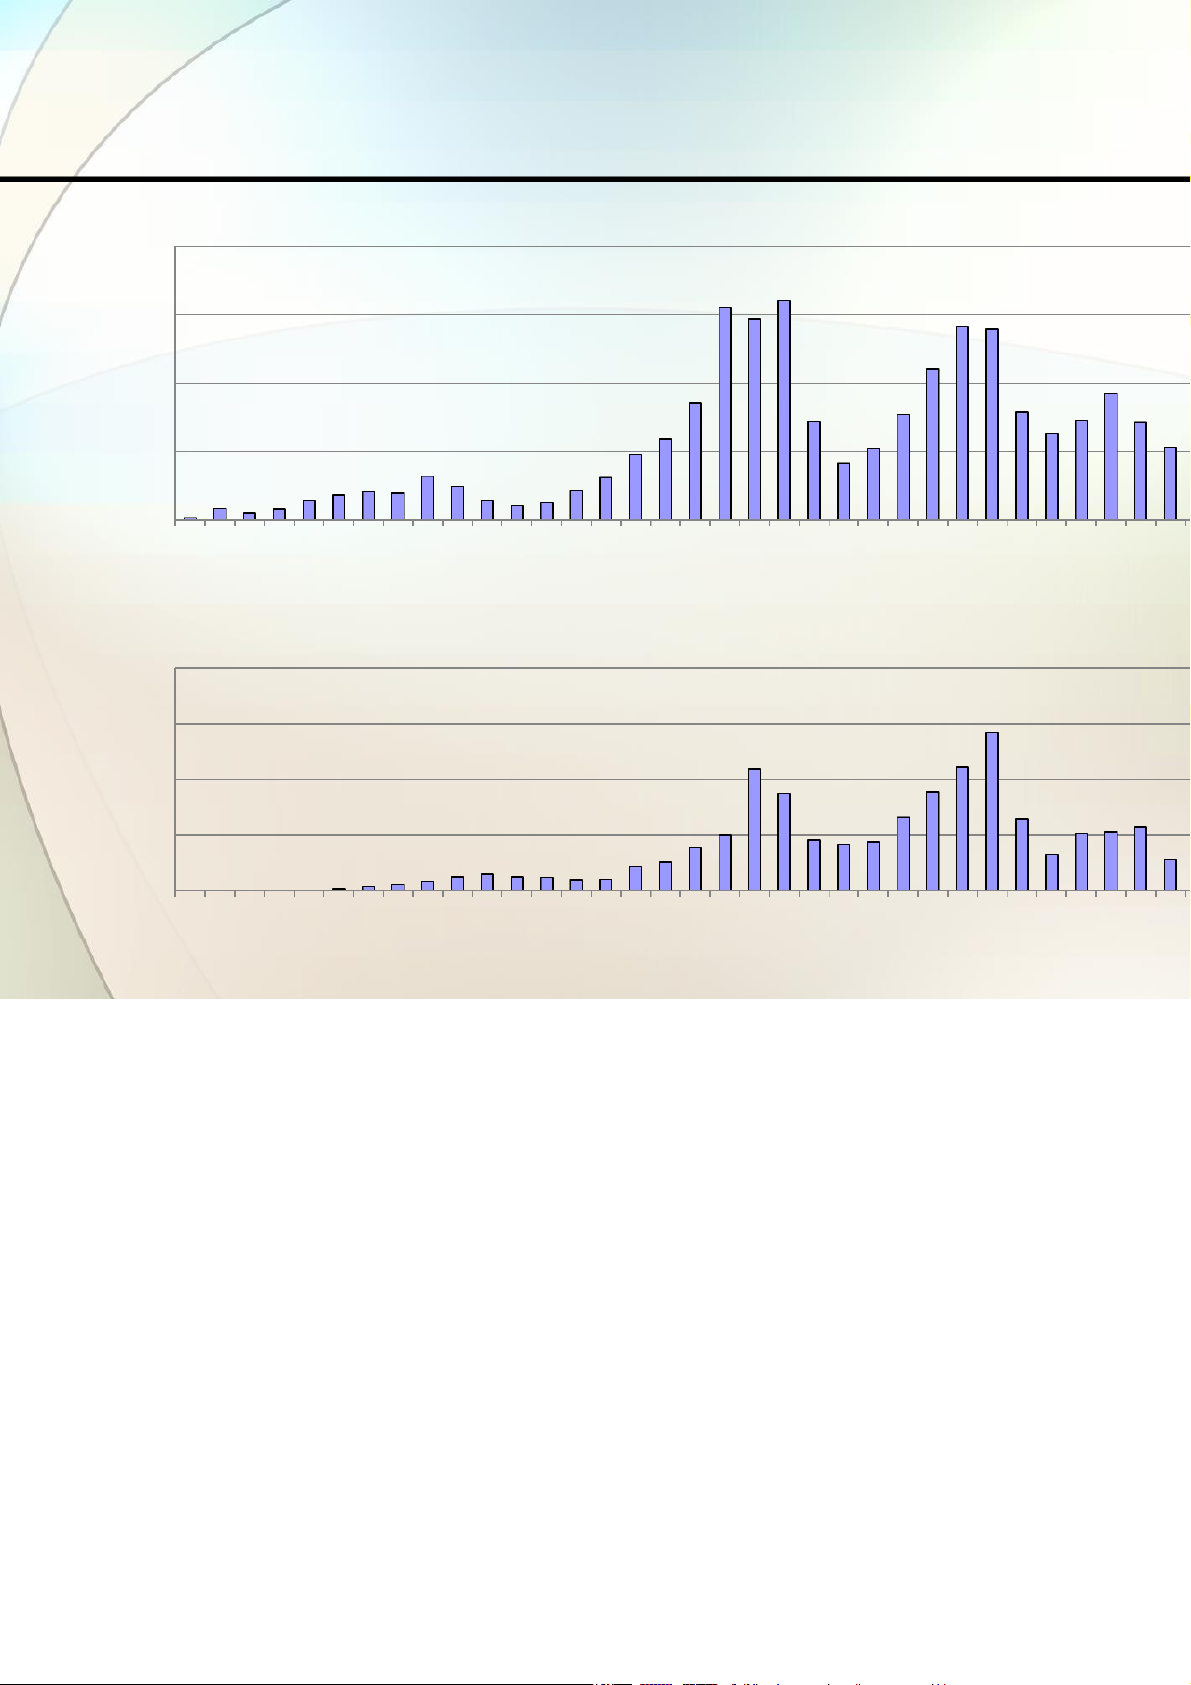
Giá Trị Các Thương Vụ Sáp Nhập của (a) Hoa Kỳ và (b) Châu Âu
Value of U.S. M&A: 1980-2014 2,000,000 ) 1,500,000 1,000,000 500,000 0 1980 1982 1984 1986 1988 1990 1992 1994 1996 1998 2000 2002 2004 2006 2008 2010 2012
Value of Europe M&A: 1980-2014 ) 2,000,000 1,500,000 1,000,000 $ Millions $ Millions 500,000 0 1980
1981 98219831984198519861987198819891990199119921993199419951996199719981999200020012002 003200420052006200720082009201020112012 01
Thomson Securities Financial Data
All Rights Reserved. © May not be reproduced, copied, or otherwise used without the express, written permission of Dr. Patrick Gaughan
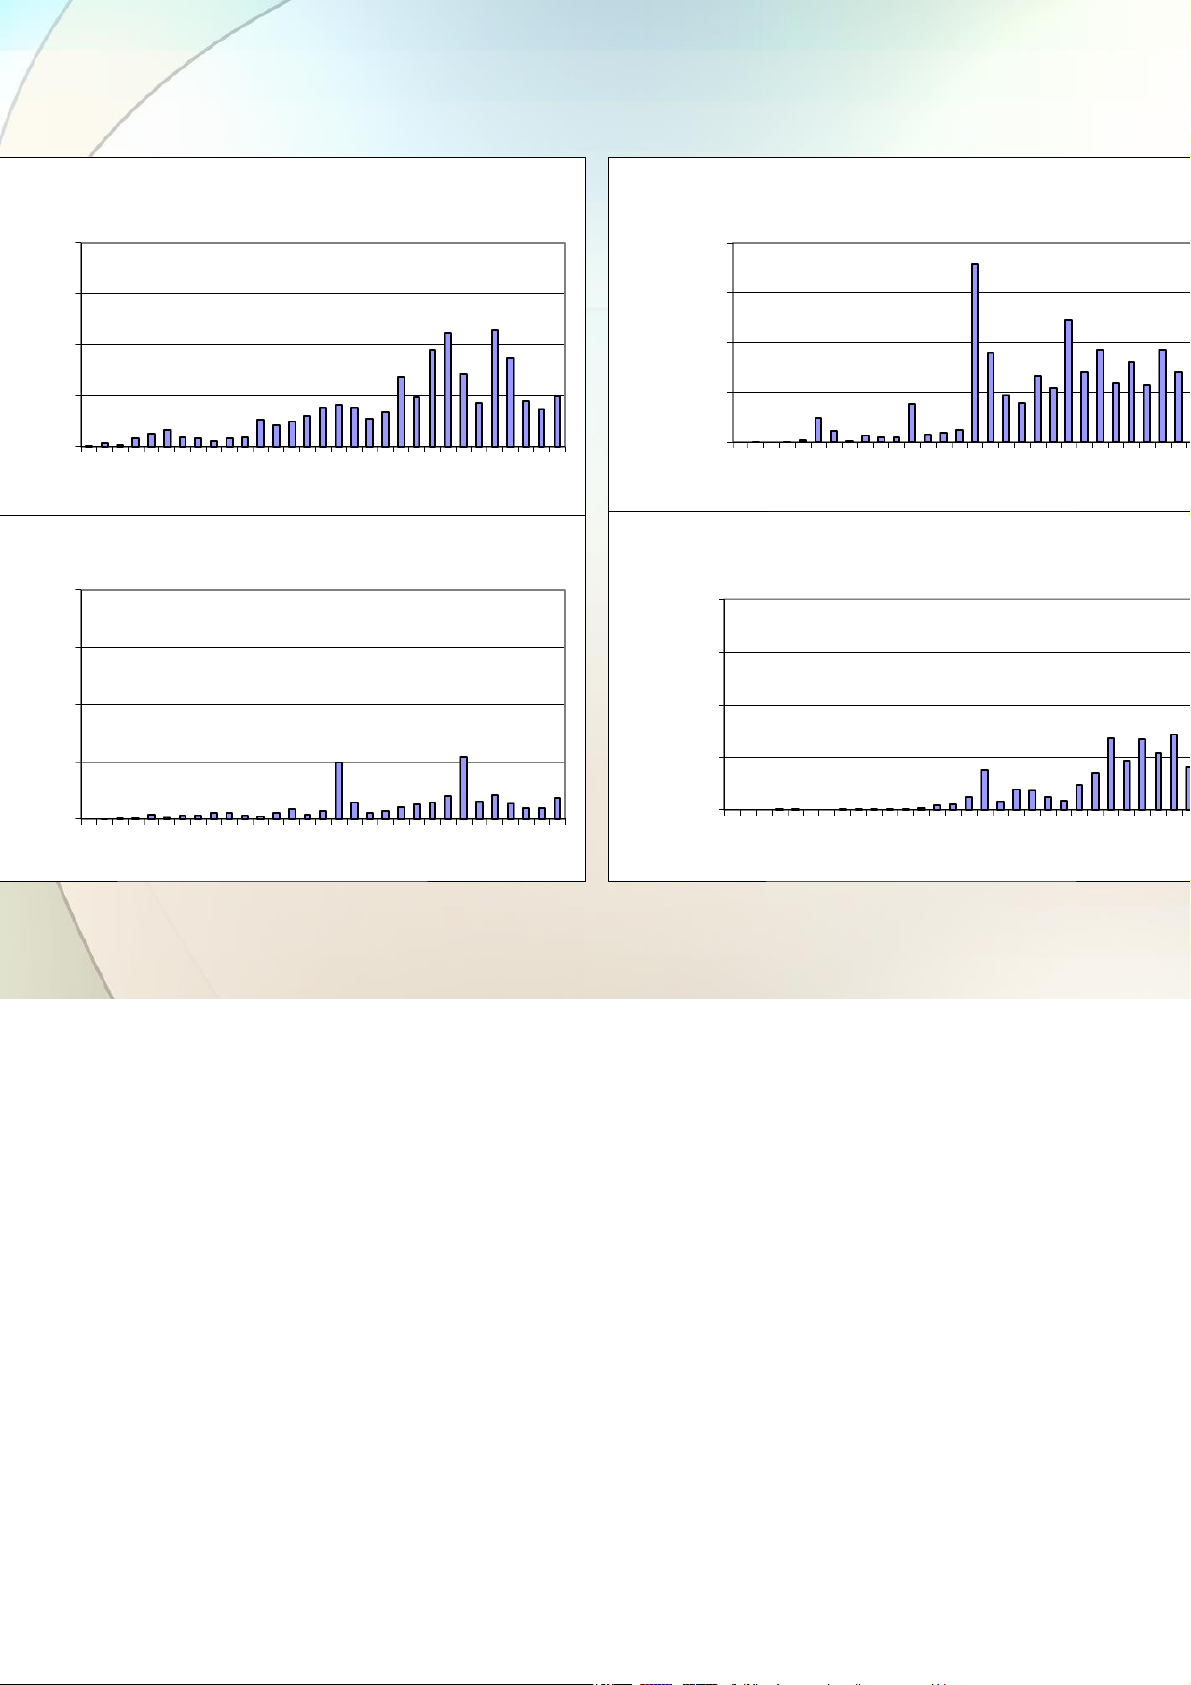
Tổng giá trị của Mua bán & Sáp nhập: Châu Á Australia Japan 00 200,000 00 150,000 00 100,000 Millions 0 50,000 $ Millions 1984
198619881990199219941996199820002002 0042006200820102012 014 1984
198619881990199219941996199820002002 00420062008201020 Hong Kong China 00 200,000 00 150,000 00 100,000 $ Millions 0 50,000 Millions 1984
198619881990199219941996199820002002 0042006200820102012 014 1984
198619881990199219941996199820002002200420062008201020
urce: Thomson Financial Securities Data
All Rights Reserved. © May not be reproduced, copied, or otherwise used without the express, written permission of Dr. Patrick Gaughan
Tổng giá trị của Mua bán & Sáp nhập: Châu Á (t.t) South Korea India 00 200 00 150 00 100 0 $ Millions 50 Millions 1984 19861988199019921994 1996
199820002002 0042006200820102012 014 1984
198619881990199219941996199820002002200420062008201020 Taiwan 200,000 150,000 100,000 $ Millions 50,000 1984
198619881990199219941996199820002002200420062008201020122014
urce: Thomson Financial Securities Data
All Rights Reserved. © May not be reproduced, copied, or otherwise used without the express, written permission of Dr. Patrick Gaughan
Khối Lượng Giao Dịch Mua Bán và Sáp Nhập tại Châu Á
Sự tăng trưởng mạnh mẽ trong làn sóng sáp nhập thứ năm
Khối lượng giao dịch vẫn còn thấp hơn nhiều so với Hoa Kỳ và Châu Âu
Một phần do việc nới lỏng quy định ở các nền kinh tế như Trun
Quốc, Nhật Bản và Hàn Quốc, cũng như sự tăng trưởng mạnh mẽ ở
các nền kinh tế như Trung Quốc và Ấn Độ
All Rights Reserved. © May not be reproduced, copied, or otherwise used without the express, written permission of Dr. Patrick Gaughan
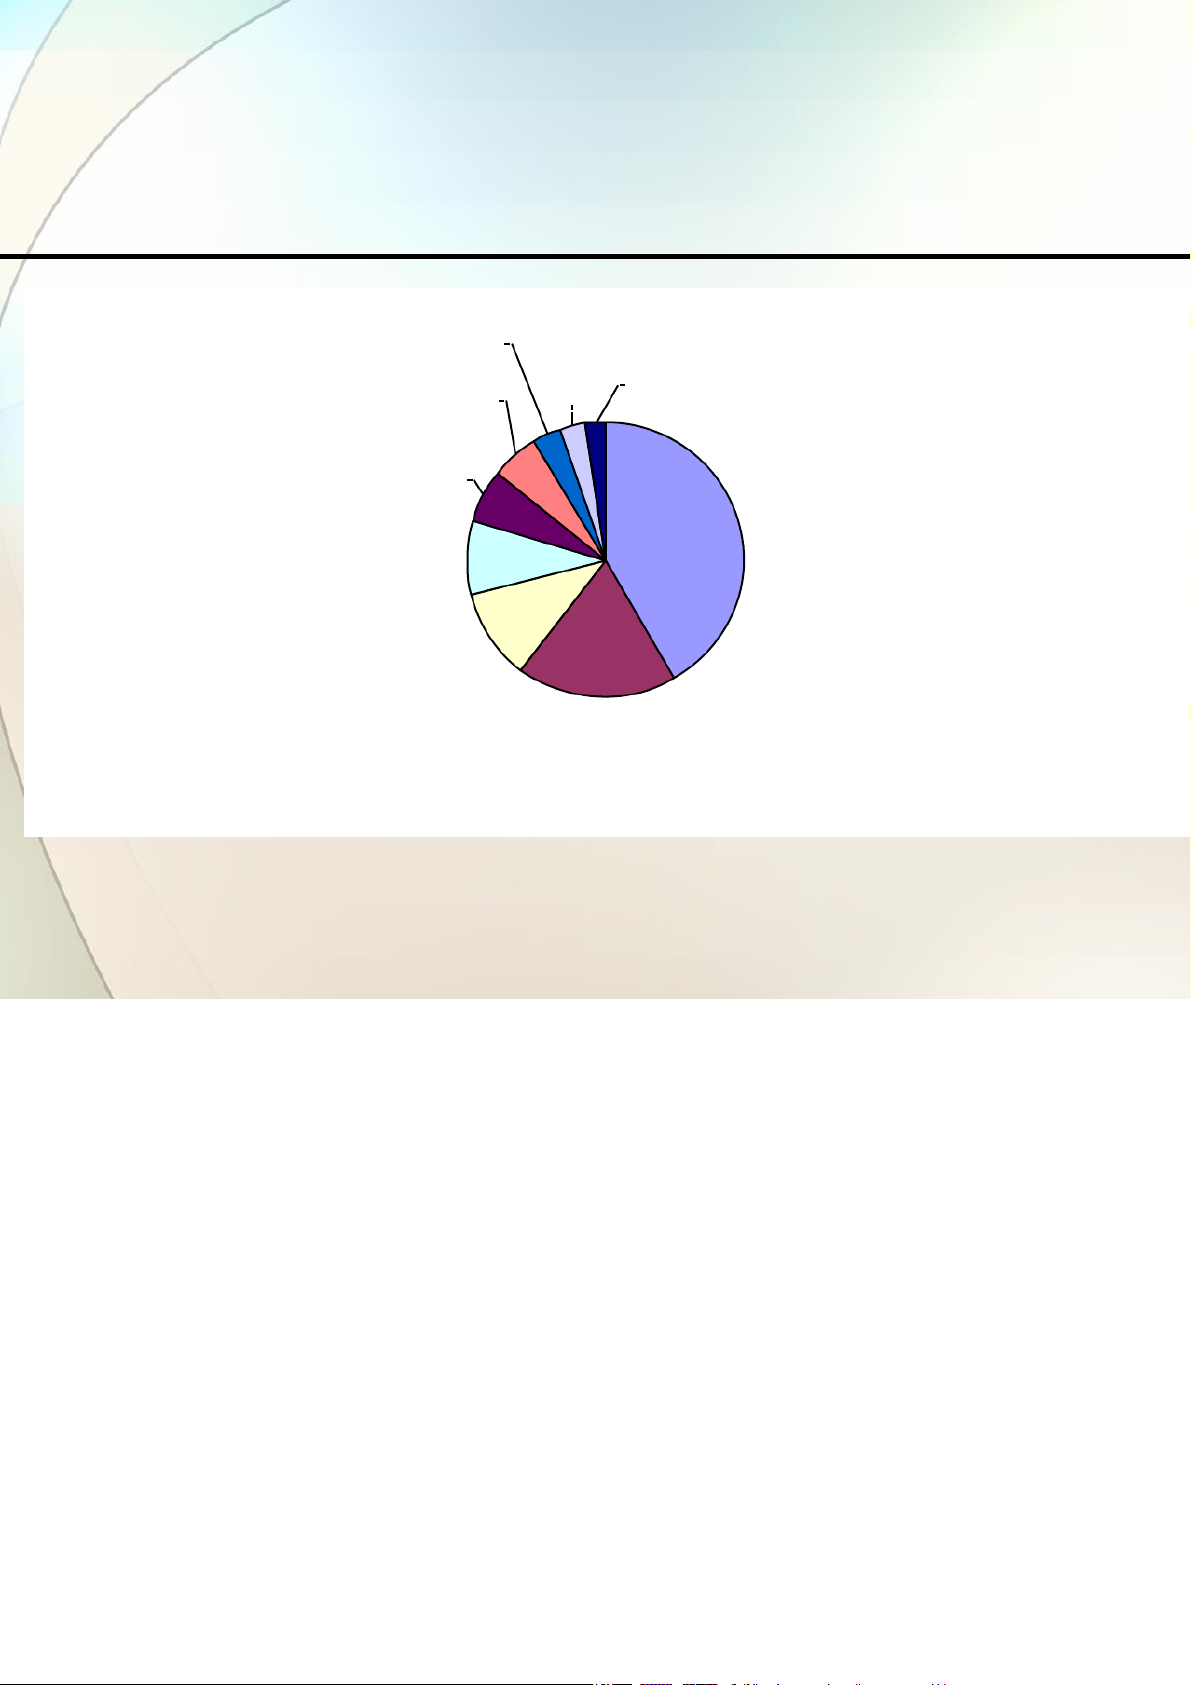
Tỷ Lệ Phần Trăm Phí Ngân Hàng Đầu
Tư Tổng Cộng của Khu Vực Châu Á - Thái Bình Dương Năm 2004 Taiwan 3% India 3%Other South Korea 2% 6% Hong Kong 6% Japan Southeast Asia 9% 41% China 11% Australia 19% Source: Wall Street Journal
All Rights Reserved. © May not be reproduced, copied, or otherwise used without the express, written permission of Dr. Patrick Gaughan
Tổng Giá Trị Mua Bán và Sáp Nhập:
Trung và Nam Mỹ (1985-2014) 140,000 120,000 Central America South America 100,000 80,000 60,000 $ Millions 40,000 20,000 0
85 87 89 91 93 95 97 99 01 03 05 07 09 11 13
Source: Thomson Financial Securities Data
All Rights Reserved. © May not be reproduced, copied, or otherwise used without the express, written permission of Dr. Patrick Gaughan
Nhà Thâu Tóm Thị Trường Mới Nổi
Một loại nhà thầu mới trở nên quan trọng trong làn sóng thứ nă và những năm 2000
Ví dụ: Các thương vụ mua lại các công ty thép trên toàn thế giớ của Mittal
All Rights Reserved. © May not be reproduced, copied, or otherwise used without the express, written permission of Dr. Patrick Gaughan Xu Hướng Gần Đây
Sự tăng trưởng của các nhà thâu tóm thị trường mới nổi
Sự tăng trưởng của các khoản đầu tư từ quỹ đầu tư nhà nước nước ng
Sự gia tăng về mức độ phổ biến của SPACs (công ty mua lại với mục đích đặc biệt)
All Rights Reserved. © May not be reproduced, copied, or otherwise used without the express, written permission of Dr. Patrick Gaughan
Các Quỹ Đầu Tư Nhà Nước Nước Ngoài
Các nguồn vốn lớn được kiểm soát bởi chính phủ
Hai trong số các quỹ lớn nhất là:
Abu Dhabi: 900 tỷ USD tài sản
oAbu Dhabi sở hữu 9% trữ lượng dầu mỏ thế giới và 0,02% dân s thế giới
oNăm 2007, đầu tư 7,5 tỷ USD vào Citigroup
ingapore: 300 tỷ USD tài sản
oĐã thực hiện các khoản đầu tư lớn vào Citigroup, Merrill Lynch UBS
Cho đến nay, các khoản đầu tư đều là đầu tư
thiểu số – không nhằm mục đích kiểm soát
Rights Reserved. © May not be reproduced, copied, or otherwise used without the express, written permission of Dr. Patrick Gaughan.
Tài liệu liên quan:
-
Essential Cheat Sheet for Mergers & Acquisitions Basics môn Sáp nhập, mua lại và tái cấu trúc doanh nghiệp | Trường Đại học Kinh tế Thành phố Hồ Chí Minh
8 4 -
Phân Tích Tình Hình Tài Chính và Chiến Lược CEC môn Sáp nhập, mua lại và tái cấu trúc doanh nghiệp | Trường Đại học Kinh tế Thành phố Hồ Chí Minh
11 6 -
Nghiên cứu Tình Huống M&A: Phân Tích Thương Vụ Sony-Columbia - BTTG môn Sáp nhập, mua lại và tái cấu trúc doanh nghiệp | Trường Đại học Kinh tế Thành phố Hồ Chí Minh
11 6 -
Đề cương chi tiết về Thoái Vốn và Bán Công Ty môn Sáp nhập, mua lại và tái cấu trúc doanh nghiệp | Trường Đại học Kinh tế Thành phố Hồ Chí Minh
10 5 -
Chương 11: Tái cấu trúc Doanh Nghiệp trong M&A | Tiểu luận môn Sáp nhập, mua lại và tái cấu trúc doanh nghiệp | Trường Đại học Kinh tế Thành phố Hồ Chí Minh
8 4