Econ 101: Appendix 2 - Statistical Distributions & Critical Values | Môn Econometrics with Financial Application - Trường Đại học Quốc tế, Đại học Quốc gia Thành phố Hồ Chí Minh
Econ 101: Appendix 2 - Statistical Distributions & Critical Values Môn Econometrics with Financial Application. Tài liệu được sưu tầm gồm 14 trang, giúp bạn ôn tập tốt hơn. Mời các bạn đón xem.
Môn: Econometrics with Financial Application (BA174IU) 10 tài liệu
Trường: Trường Đại học Quốc tế, Đại học Quốc gia Thành phố Hồ Chí Minh 2 K tài liệu
Tác giả:
Preview text:
lOMoAR cPSD| 58583460 Appendix 2
Tables of Statistical Distributions
Table A2.1 Normal critical values for different values of α α 0.4 0.25 0.2 0.15 0.1 0.05 0.025 0.0 Zα
.2533 .6745 .8416 1.0364 1.2816 1.6449 1.9600 2.3
Source: Author’s computation using the NORMDIST function in Excel.
Table A2.2 Critical values of Student’s t-distribution for different probability
levels, α and degrees of freedom, ν α 0.4 0.25 0.15 0.1 0.05 0.025 0.01 ν 1 0.324 1.000 1.962 3.077 6.313 12.706 31.820 9 0 6 7 8 2 5 2 0.288 0.816 1.386 1.885 2.920 4.3027 6.9646 7 5 2 6 0 3 0.276 0.764 1.249 1.637 2.353 3.1824 4.5407 7 9 8 7 4 4 0.270 0.740 1.189 1.533 2.131 2.7764 3.7469 7 7 6 2 8 5 0.267 0.726 1.155 1.475 2.015 2.5706 3.3649 2 7 8 9 0 6 0.264 0.717 1.134 1.439 1.943 2.4469 3.1427 8 6 2 8 2 7 0.263 0.711 1.119 1.414 1.894 2.3646 2.9980 2 1 2 9 6 lOMoAR cPSD| 58583460 8 0.261 0.706 1.108 1.396 1.859 2.3060 2.8965 9 4 1 8 5 9 0.261 0.702 1.099 1.383 1.833 2.2622 2.8214 0 7 7 0 1 1 0.260 0.699 1.093 1.372 1.812 2.2281 2.7638 0 2 8 1 2 5 1 0.259 0.697 1.087 1.363 1.795 2.2010 2.7181 1 6 4 7 4 9 1 0.259 0.695 1.083 1.356 1.782 2.1788 2.6810 2 0 5 2 2 3 13
0.2586 0.6938 1.0795 1.3502 1.7709 2.1604 2.6503 14
0.2582 0.6924 1.0763 1.3450 1.7613 2.1448 2.6245 15
0.2579 0.6912 1.0735 1.3406 1.7531 2.1314 2.6025 16
0.2576 0.6901 1.0711 1.3368 1.7459 2.1199 2.5835 17
0.2573 0.6892 1.0690 1.3334 1.7396 2.1098 2.5669 18
0.2571 0.6884 1.0672 1.3304 1.7341 2.1009 2.5524 19
0.2569 0.6876 1.0655 1.3277 1.7291 2.0930 2.5395 20
0.2567 0.6870 1.0640 1.3253 1.7247 2.0860 2.5280 21
0.2566 0.6864 1.0627 1.3232 1.7207 2.0796 2.5176 22
0.2564 0.6858 1.0614 1.3212 1.7171 2.0739 2.5083 23
0.2563 0.6853 1.0603 1.3195 1.7139 2.0687 2.4999 24
0.2562 0.6848 1.0593 1.3178 1.7109 2.0639 2.4922 25
0.2561 0.6844 1.0584 1.3163 1.7081 2.0595 2.4851 26
0.2560 0.6840 1.0575 1.3150 1.7056 2.0555 2.4786 27
0.2559 0.6837 1.0567 1.3137 1.7033 2.0518 2.4727 lOMoAR cPSD| 58583460 28
0.2558 0.6834 1.0560 1.3125 1.7011 2.0484 2.4671 29
0.2557 0.6830 1.0553 1.3114 1.6991 2.0452 2.4620 30
0.2556 0.6828 1.0547 1.3104 1.6973 2.0423 2.4573 35
0.2553 0.6816 1.0520 1.3062 1.6896 2.0301 2.4377 40
0.2550 0.6807 1.0500 1.3031 1.6839 2.0211 2.4233 45
0.2549 0.6800 1.0485 1.3006 1.6794 2.0141 2.4121 50
0.2547 0.6794 1.0473 1.2987 1.6759 2.0086 2.4033 60
0.2545 0.6786 1.0455 1.2958 1.6706 2.0003 2.3901 70
0.2543 0.6780 1.0442 1.2938 1.6669 1.9944 2.3808 80
0.2542 0.6776 1.0432 1.2922 1.6641 1.9901 2.3739 90
0.2541 0.6772 1.0424 1.2910 1.6620 1.9867 2.3685
100 0.2540 0.6770 1.0418 1.2901 1.6602 1.9840 2.3642
120 0.2539 0.6765 1.0409 1.2886 1.6577 1.9799 2.3578
150 0.2538 0.6761 1.0400 1.2872 1.6551 1.9759 2.3515
200 0.2537 0.6757 1.0391 1.2858 1.6525 1.9719 2.3451
300 0.2536 0.6753 1.0382 1.2844 1.6499 1.9679 2.3388 ∞
0.2533 0.6745 1.0364 1.2816 1.6449 1.9600 2.3263
Source: Author’s own computation using the TINV function in Excel. lOMoAR cPSD| 58583460
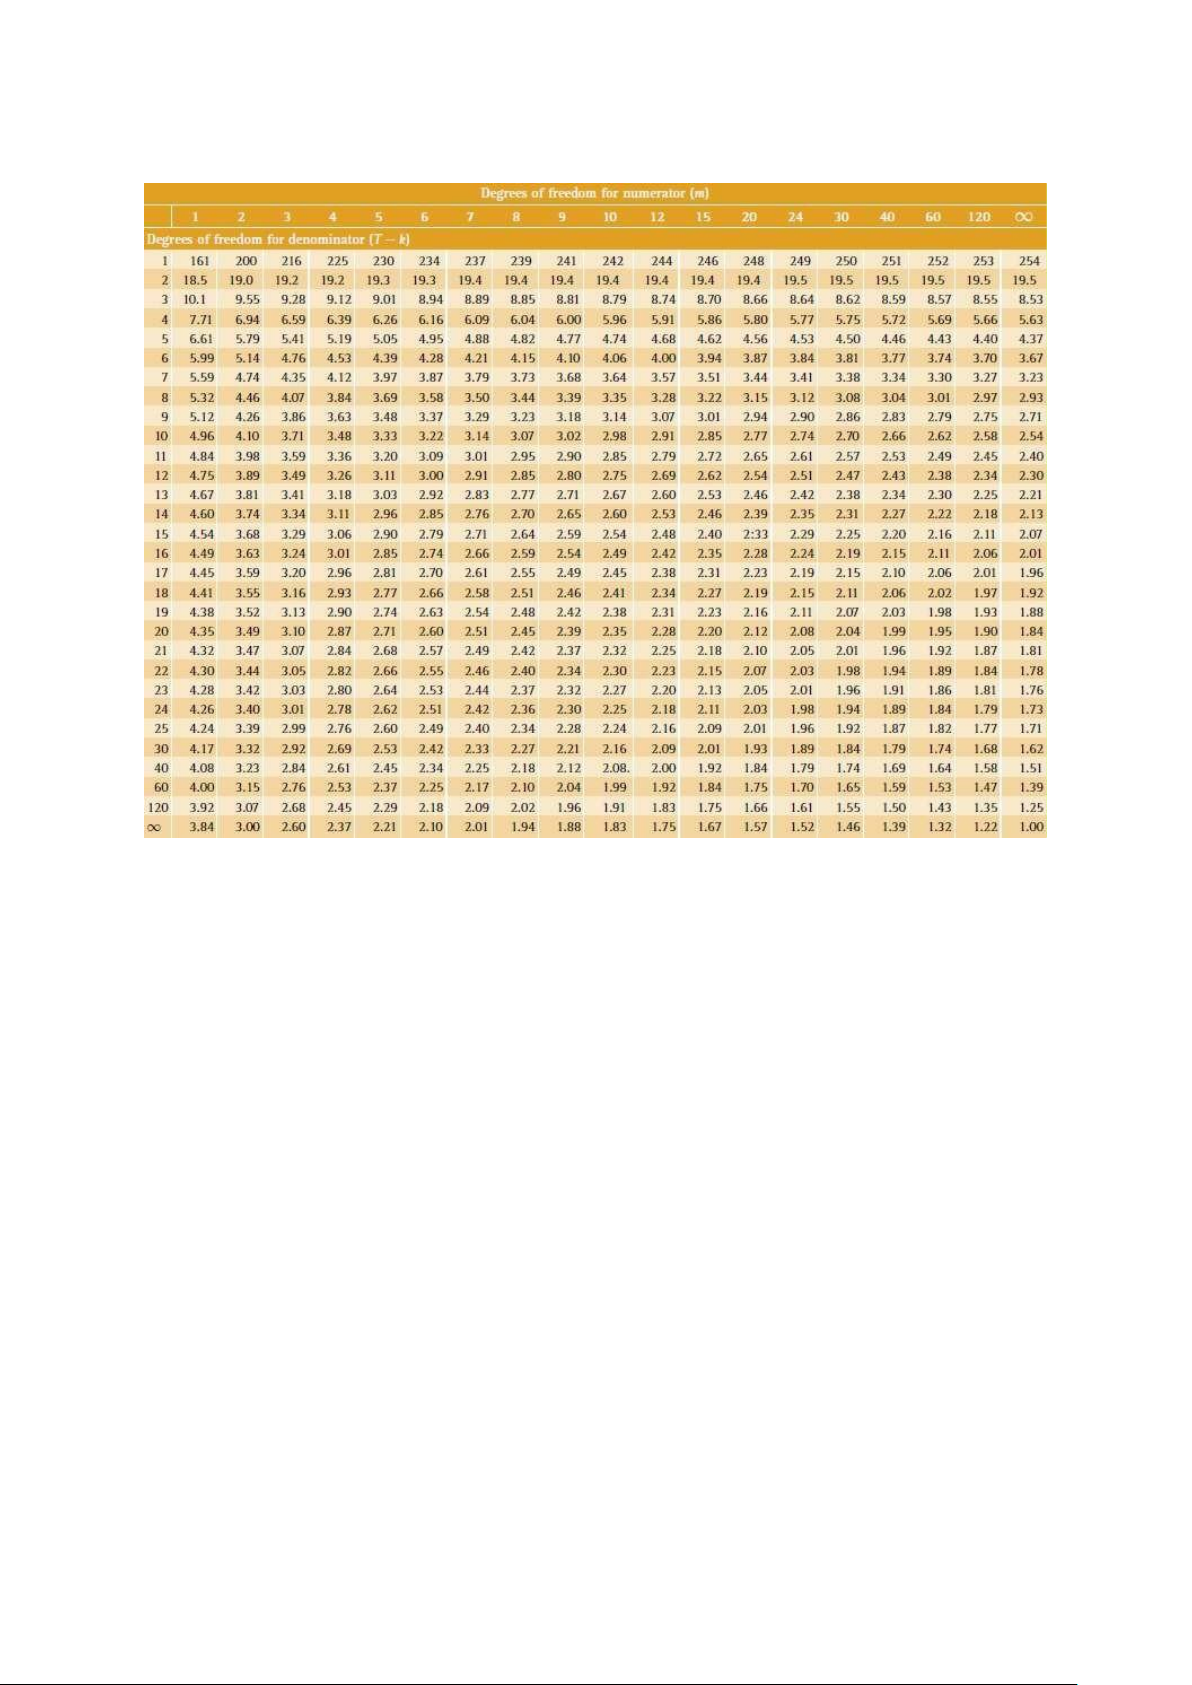
Table A2.3 Upper 5% critical values for F-distribution
Source: Author’s own computation using the Excel FINV function. lOMoAR cPSD| 58583460
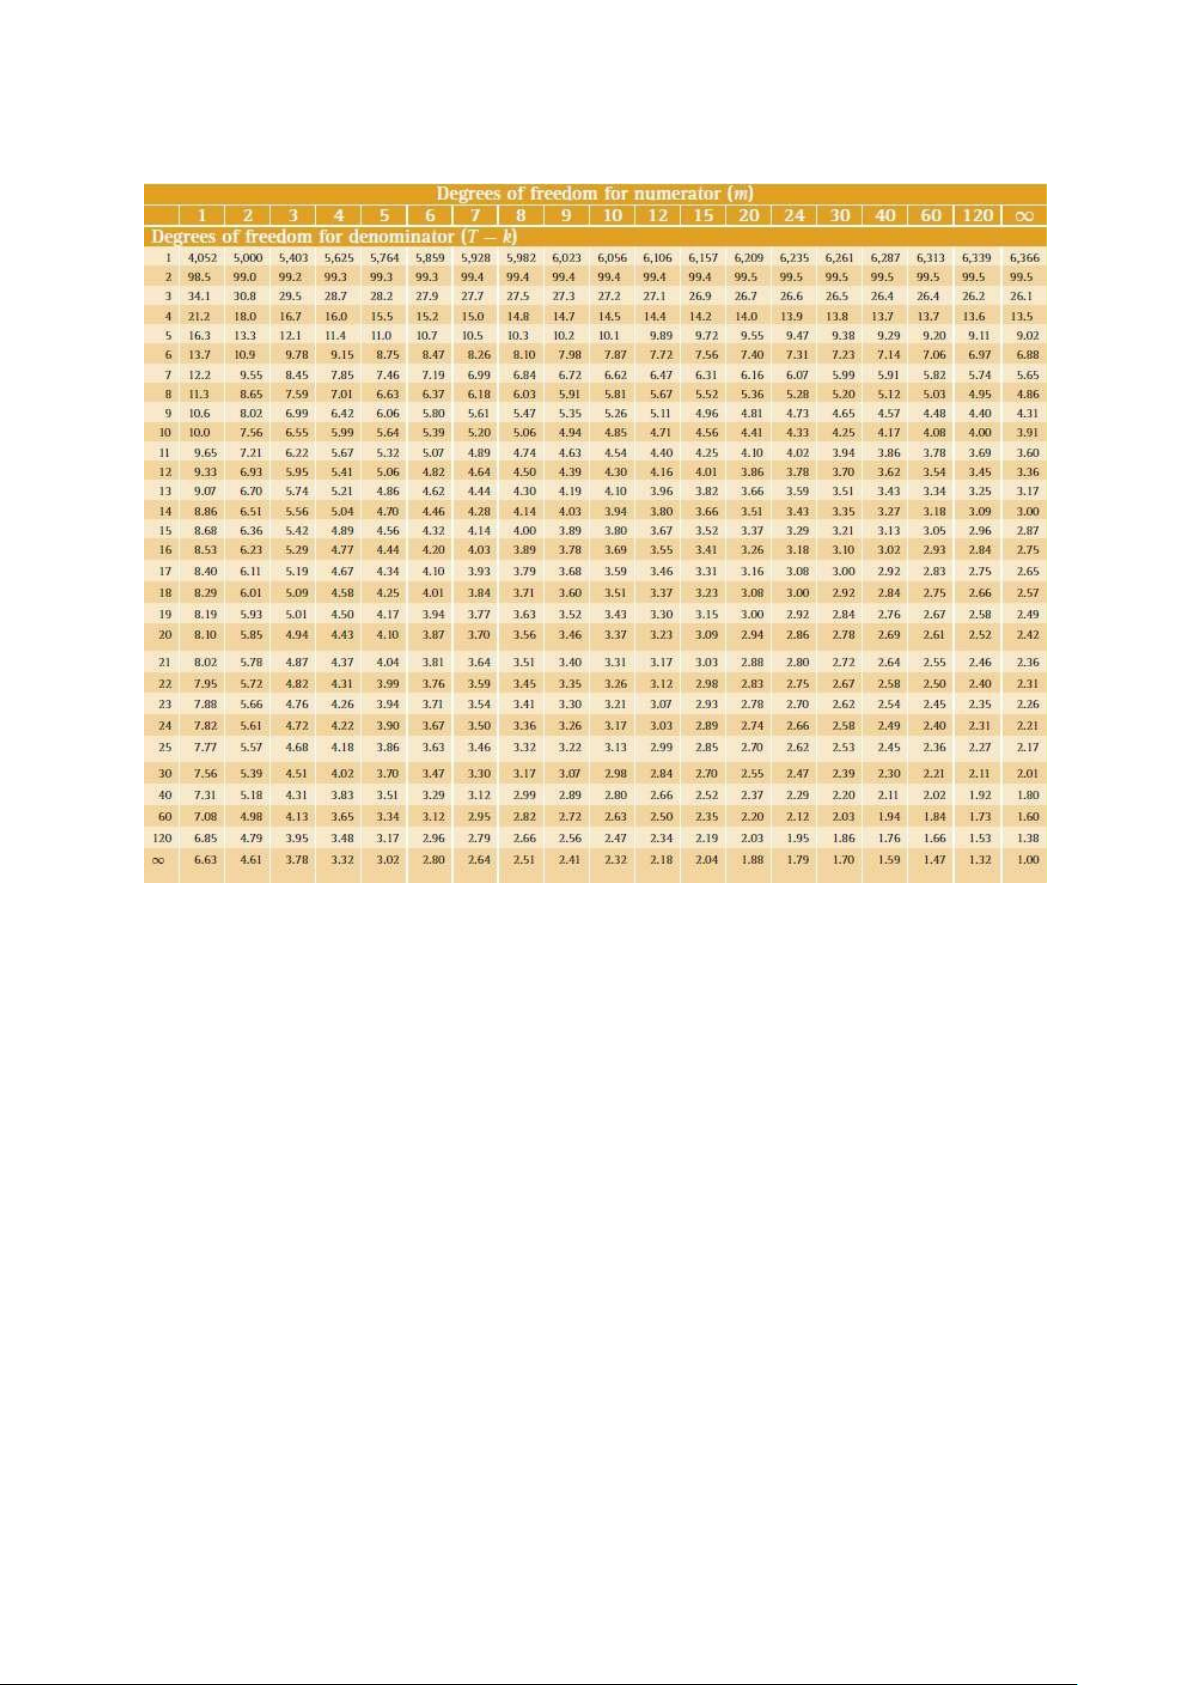
Table A2.4 Upper 1% critical values for F-distribution
Source: Author’s own computation using the Excel CHIINV function. lOMoAR cPSD| 58583460
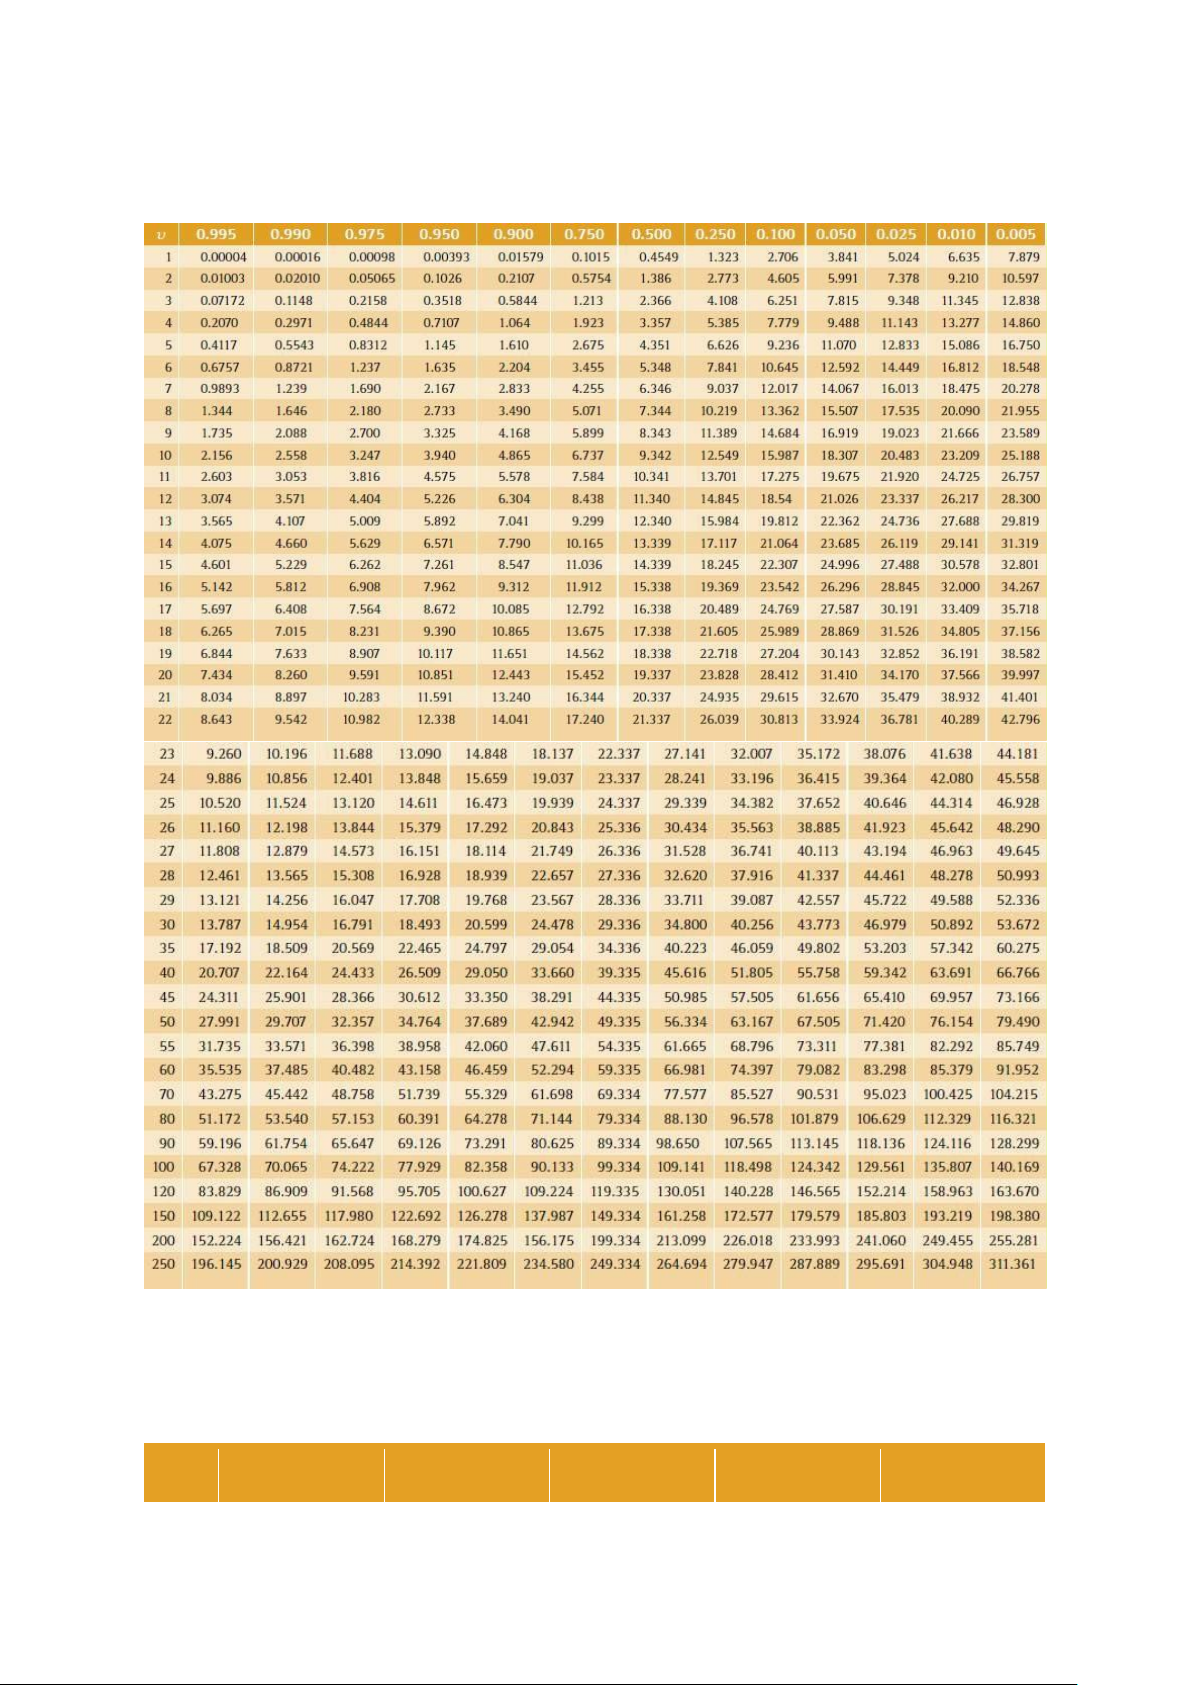
Table 2.5 Chi-squared critical values for different values of α and degrees of freedom, ν
Source: Author’s own computation using the Excel CHIINV function.
Table A2.6 Lower and upper 1% critical values for the Durbin–Watson statistic k′ = 1 k′ = 2 k′ = 3 k′ = 4 k′ = 5 lOMoAR cPSD| 58583460 T dL dU dL dU dL dU dL dU dL dU 15 0.8 1.0 0.7 1.2 0.5 1.4 0.4 1.7 0.3 1.9 1 7 0 5 9 6 9 0 9 6 16 0.8 1.0 0.7 1.2 0.6 1.4 0.5 1.6 0.4 1.9 4 9 4 5 3 4 3 6 4 0 17 0.8 1.1 0.7 1.2 0.6 1.4 0.5 1.6 0.4 1.8 7 0 7 5 7 3 7 3 8 5 18 0.9 1.1 0.8 1.2 0.7 1.4 0.6 1.6 0.5 1.8 0 2 0 6 1 2 1 0 2 0 19 0.9 1.1 0.8 1.2 0.7 1.4 0.6 1.5 0.5 1.7 3 3 3 6 4 1 5 8 6 7 20 0.9 1.1 0.8 1.2 0.7 1.4 0.6 1.5 0.6 1.7 5 5 6 7 7 1 8 7 0 4 21 0.9 1.1 0.8 1.2 0.8 1.4 0.7 1.5 0.6 1.7 7 6 9 7 0 1 2 5 3 1 22 1.0 1.1 0.9 1.2 0.8 1.4 0.7 1.5 0.6 1.6 0 7 1 8 3 0 5 4 6 9 23 1.0 1.1 0.9 1.2 0.8 1.4 0.7 1.5 0.7 1.6 2 9 4 9 6 0 7 3 0 7 24 1.0 1.2 0.9 1.3 0.8 1.4 0.8 1.5 0.7 1.6 4 0 6 0 8 1 0 3 2 6 25 1.0 1.2 0.9 1.3 0.9 1.4 0.8 1.5 0.7 1.6 5 1 8 0 0 1 3 2 5 5 26 1.0 1.2 1.0 1.3 0.9 1.4 0.8 1.5 0.7 1.6 7 2 0 1 3 1 5 2 8 4 27 1.0 1.2 1.0 1.3 0.9 1.4 0.8 1.5 0.8 1.6 9 3 2 2 5 1 8 1 1 3 28 1.1 1.2 1.0 1.3 0.9 1.4 0.9 1.5 0.8 1.6 0 4 4 2 7 1 0 1 3 2 29 1.1 1.2 1.0 1.3 0.9 1.4 0.9 1.5 0.8 1.6 2 5 5 3 9 2 2 1 5 1 lOMoAR cPSD| 58583460 30 1.1 1.2 1.0 1.3 1.0 1.4 0.9 1.5 0.8 1.6 3 6 7 4 1 2 4 1 8 1 31 1.1 1.2 1.0 1.3 1.0 1.4 0.9 1.5 0.9 1.6 5 7 8 4 2 2 6 1 0 0 32 1.1 1.2 1.1 1.3 1.0 1.4 0.9 1.5 0.9 1.6 6 8 0 5 4 3 8 1 2 0 33 1.1 1.2 1.1 1.3 1.0 1.4 1.0 1.5 0.9 1.5 7 9 1 6 5 3 0 1 4 9 34 1.1 1.3 1.1 1.3 1.0 1.4 1.0 1.5 0.9 1.5 8 0 3 6 7 3 1 1 5 9 35 1.1 1.3 1.1 1.3 1.0 1.4 1.0 1.5 0.9 1.5 9 1 4 7 8 4 3 1 7 9 36 1.2 1.3 1.1 1.3 1.1 1.4 1.0 1.5 0.9 1.5 1 2 5 8 0 4 4 1 9 9 37 1.2 1.3 1.1 1.3 1.1 1.4 1.0 1.5 1.0 1.5 2 2 6 8 1 5 6 1 0 9 38 1.2 1.3 1.1 1.3 1.1 1.4 1.0 1.5 1.0 1.5 3 3 8 9 2 5 7 2 2 8 39 1.2 1.3 1.1 1.3 1.1 1.4 1.0 1.5 1.0 1.5 4 4 9 9 4 5 9 2 3 8 40 1.2 1.3 1.2 1.4 1.1 1.4 1.1 1.5 1.0 1.5 5 4 0 0 5 6 0 2 5 8 45 1.2 1.3 1.2 1.4 1.2 1.4 1.1 1.5 1.1 1.5 9 8 4 2 0 8 6 3 1 8 50 1.3 1.4 1.2 1.4 1.2 1.4 1.2 1.5 1.1 1.5 2 0 8 5 4 9 0 4 6 9 55 1.3 1.4 1.3 1.4 1.2 1.5 1.2 1.5 1.2 1.5 6 3 2 7 8 1 5 5 1 9 60 1.3 1.4 1.3 1.4 1.3 1.5 1.2 1.5 1.2 1.6 8 5 5 8 2 2 8 6 5 0 65 1.4 1.4 1.3 1.5 1.3 1.5 1.3 1.5 1.2 1.6 1 7 8 0 5 3 1 7 8 1 lOMoAR cPSD| 58583460 70 1.4 1.4 1.4 1.5 1.3 1.5 1.3 1.5 1.3 1.6 3 9 0 2 7 5 4 8 1 1 75 1.4 1.5 1.4 1.5 1.3 1.5 1.3 1.5 1.3 1.6 5 0 2 3 9 6 7 9 4 2 80 1.4 1.5 1.4 1.5 1.4 1.5 1.3 1.6 1.3 1.6 7 2 4 4 2 7 9 0 6 2 85 1.4 1.5 1.4 1.5 1.4 1.5 1.4 1.6 1.3 1.6 8 3 6 5 3 8 1 0 9 3 90 1.5 1.5 1.4 1.5 1.4 1.5 1.4 1.6 1.4 1.6 0 4 7 6 5 9 3 1 1 4 95 1.5 1.5 1.4 1.5 1.4 1.6 1.4 1.6 1.4 1.6 1 5 9 7 7 0 5 2 2 4 10 1.5 1.5 1.5 1.5 1.4 1.6 1.4 1.6 1.4 1.6 0 2 6 0 8 8 0 6 3 4 5
Note: T, number of observations; k′, number of explanatory variables (excluding a constant term).
Source: Durbin and Watson (1951): 159–77. Reprinted with the permission of Oxford University Press.
Table A2.7 Dickey–Fuller critical values for different significance levels, α Sample 0.01 0.025 0.05 0.10 size T τ 25 −2.66 −2.26 −1.95 −1.60 50 −2.62 −2.25 −1.95 −1.61 100 −2.60 −2.24 −1.95 −1.61 250 −2.58 −2.23 −1.95 −1.62 500 −2.58 −2.23 −1.95 −1.62 ∞ −2.58 −2.23 −1.95 −1.62 lOMoAR cPSD| 58583460 τμ 25 −3.75 −3.33 −3.00 −2.63 50 −3.58 −3.22 −2.93 −2.60 100 −3.51 −3.17 −2.89 −2.58 250 −3.46 −3.14 −2.88 −2.57 500 −3.44 −3.13 −2.87 −2.57 ∞ −3.43 −3.12 −2.86 −2.57 ττ 25 −4.38 −3.95 −3.60 −3.24 50 −4.15 −3.80 −3.50 −3.18 100 −4.04 −3.73 −3.45 −3.15 250 −3.99 −3.69 −3.43 −3.13 500 −3.98 −3.68 −3.42 −3.13 ∞ −3.96 −3.66 −3.41 −3.12
Source: Fuller (1976). Reprinted with the permission of John Wiley and Sons.
Table A2.8 Critical values for the Engle–Granger cointegration test on
regression residuals with no constant in test regression Number of variables in Sample system size T 0.01 0.05 0.10 50 −4.32 −3.67 −3.28 2 100 −4.07 −3.37 −3.03 lOMoAR cPSD| 58583460 200 −4.00 −3.37 −3.02 50 −4.84 −4.11 −3.73 3 100 −4.45 −3.93 −3.59 200 −4.35 −3.78 −3.47 50 −4.94 −4.35 −4.02 4 100 −4.75 −4.22 −3.89 200 −4.70 −4.18 −3.89 50 −5.41 −4.76 −4.42 5 100 −5.18 −4.58 −4.26 200 −5.02 −4.48 −4.18
Source: Engle and Granger (1987). Reprinted with the permission of Elsevier. lOMoAR cPSD| 58583460
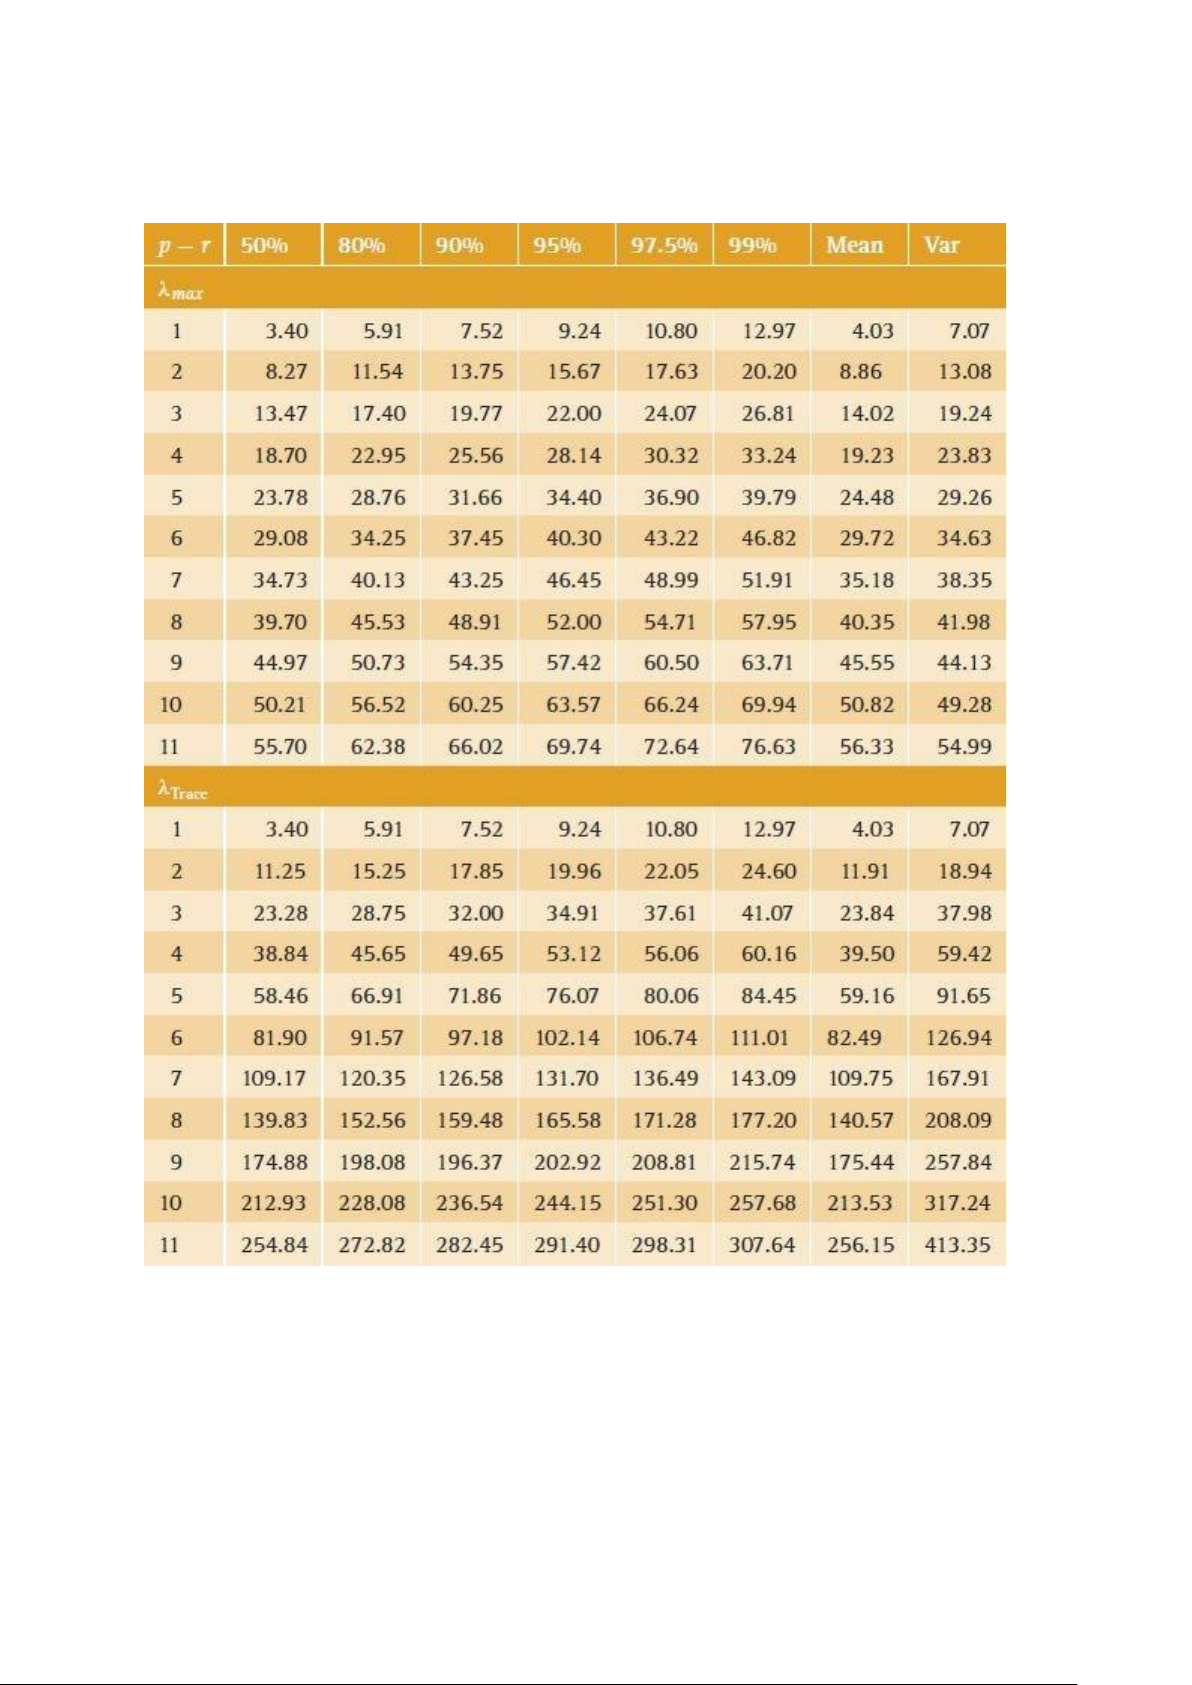
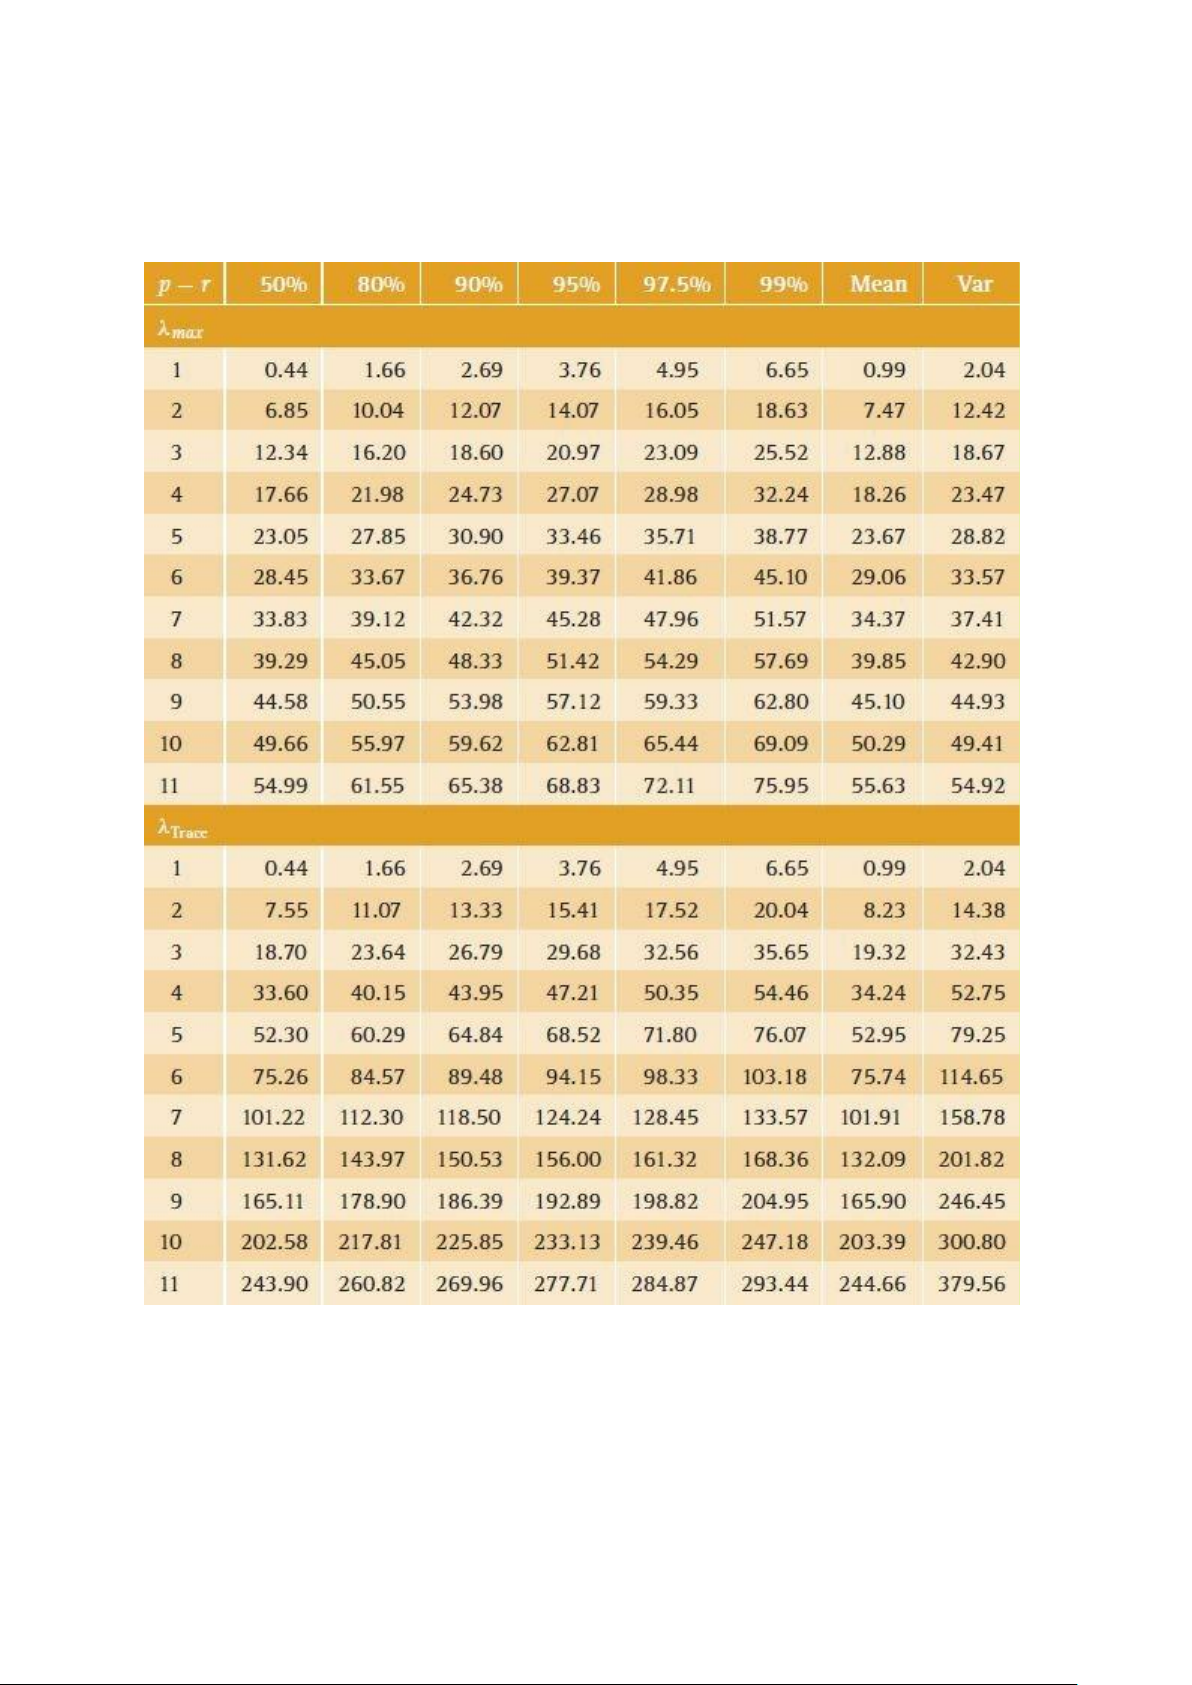
Table A2.9 Quantiles of the asymptotic distribution of the Johansen
cointegration rank test statistics (constant in cointegrating vectors only)
Source: Osterwald-Lenum (1992, Table 1*). Reprinted with the permission of Blackwell Publishers. lOMoAR cPSD| 58583460
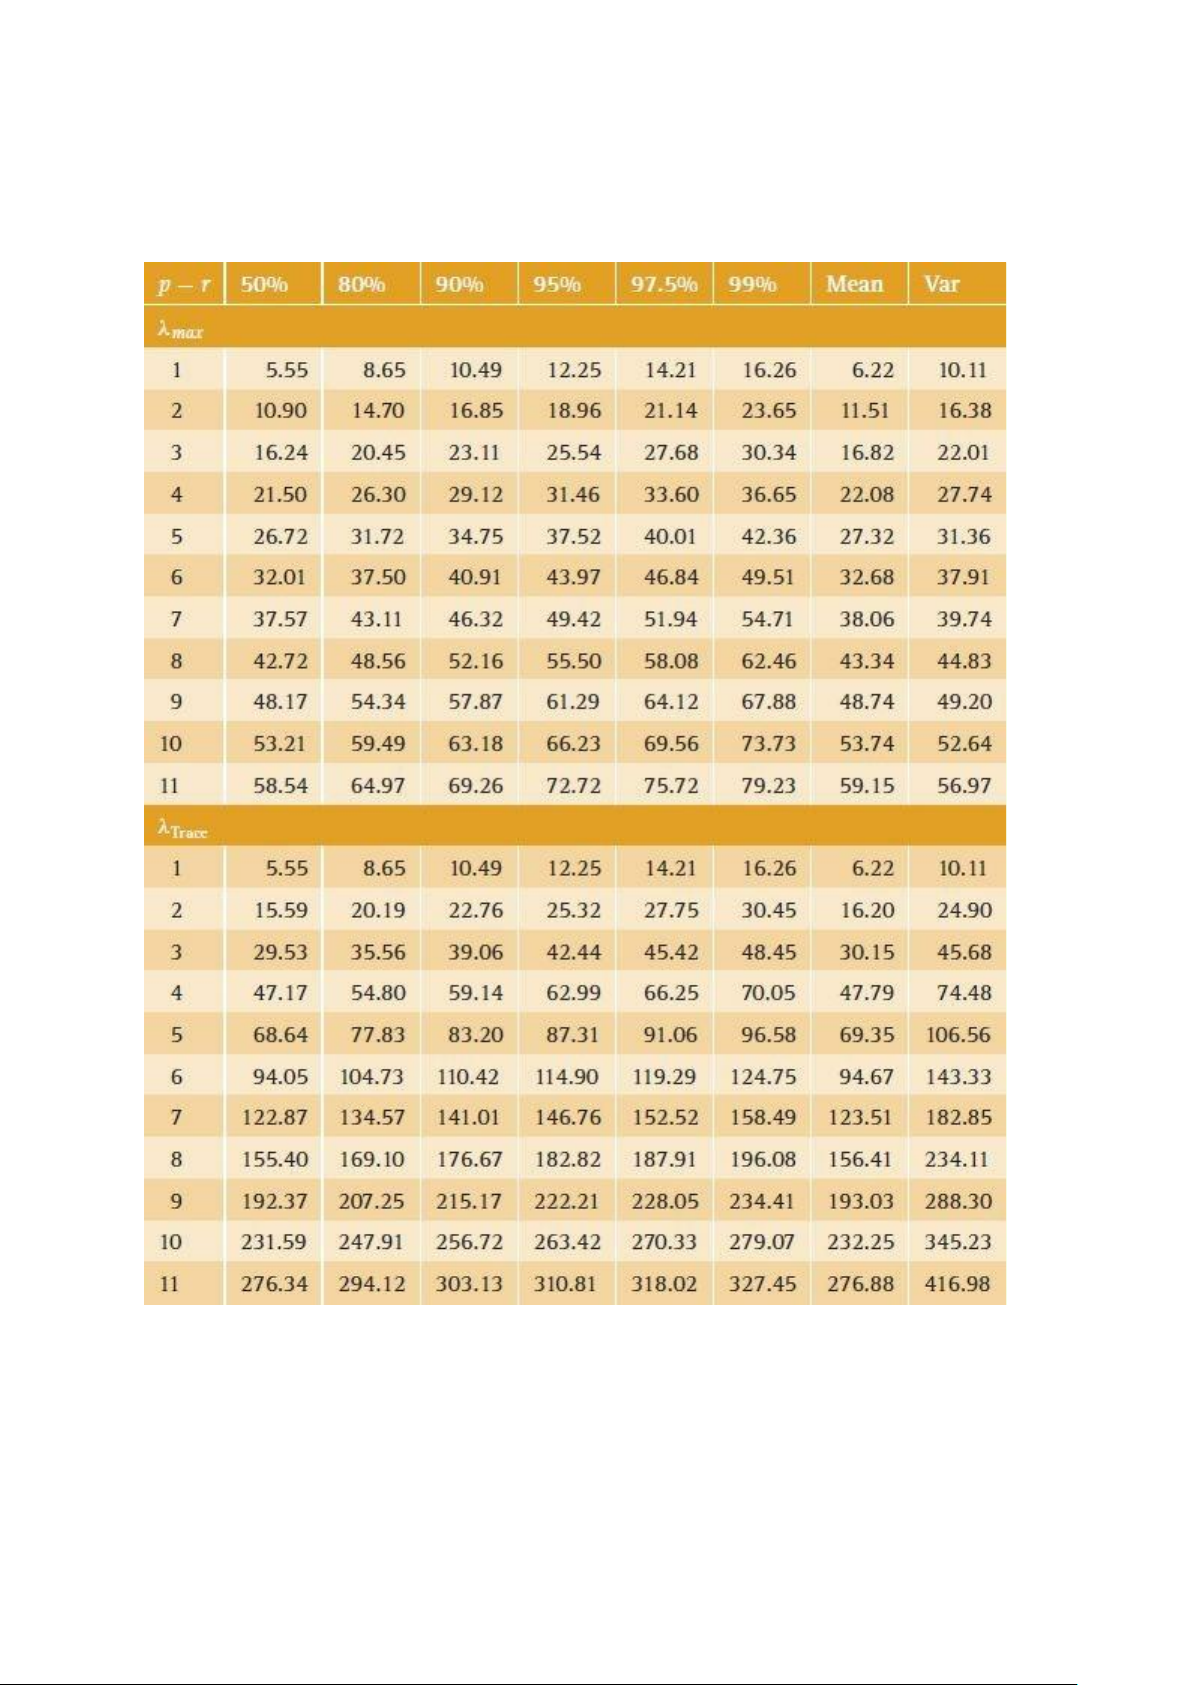
Table A2.10 Quantiles of the asymptotic distribution of the Johansen
cointegration rank test statistics (constant, i.e., a drift only in VAR and in cointegrating vector)
Source: Osterwald-Lenum (1992, Table 1). Reprinted with the permission of Blackwell Publishers. lOMoAR cPSD| 58583460
Table A2.11 Quantiles of the asymptotic distribution of the Johansen
cointegration rank test statistics (constant in cointegrating vector and VAR,
trend in cointegrating vector)
Source: Osterwald-Lenum (1992, Table 2*). Reprinted with the permission of Blackwell Publishers.
Tài liệu liên quan:
-

Econ Review: Probability & Inference Concepts | Môn Econometrics with Financial Application - Trường Đại học Quốc tế, Đại học Quốc gia Thành phố Hồ Chí Minh
91 46 -
Final Report on January Effect in Vietnam Stock Market | Môn Econometrics with Financial Application - Trường Đại học Quốc tế, Đại học Quốc gia Thành phố Hồ Chí Minh
120 60 -
Chapter 5 Eco Solutions: Addressing Methodological Challenges in Regression Analysis | Môn Econometrics with Financial Application - Trường Đại học Quốc tế, Đại học Quốc gia Thành phố Hồ Chí Minh
119 60 -
Midterm Notes: Hypothesis Testing & Regression Analysis | Môn Econometrics with Financial Application - Trường Đại học Quốc tế, Đại học Quốc gia Thành phố Hồ Chí Minh
113 57 -

Syllabus: Econometrics with Financial Applications 2025 | Môn Econometrics with Financial Application - Trường Đại học Quốc tế, Đại học Quốc gia Thành phố Hồ Chí Minh
185 93