Lab 6: Mesh & Nodal Analysis of AC Circuits | Môn Principles of EE 1 - Trường Đại học Quốc tế, Đại học Quốc gia Thành phố Hồ Chí Minh
Lab 6: Mesh & Nodal Analysis of AC Circuits Môn Principles of EE 1. Tài liệu được sưu tầm gồm 7 trang, giúp bạn ôn tập tốt hơn. Mời các bạn đón xem.
Môn: Principles of EE 1 10 tài liệu
Trường: Trường Đại học Quốc tế, Đại học Quốc gia Thành phố Hồ Chí Minh 2 K tài liệu
Tác giả:


Preview text:
lOMoAR cPSD| 58097008 INTERNATIONAL UNIVERSITY
SCHOOL OF ELECTRICAL ENGINEERING (EE) EE052 PRINCIPLES OF EE1 LAB Lab 6
Mesh and Nodal Analysis of AC Circuits
Full name: ……………………………………………
Student number: …………………………………….
Class: ………………………………………………....
Date: …………………………………………………. lOMoAR cPSD| 58097008 INTERNATIONAL UNIVERSITY
SCHOOL OF ELECTRICAL ENGINEERING (EE) I. OBJECTIVES
After completing this experiment you should be able to: 1.
Verify experimentally the AC mesh-current technique. 2.
Verify experimentally the AC node-voltage technique. 3.
Generate an AC source using a phase-shifting network. II. INTRODUCTION
This laboratory experiment explores two different techniques to solve AC circuits:
mesh-current and node-voltage. In the first section, we are going to experimentally measure
the mesh currents of an AC circuit that has been previously calculated in the Pre-Lab using the
AC mesh-current method. In a similar fashion, the second section corroborates the nodevoltage
technique by comparing the experimentally measure node voltages with the node voltages
calculated in the Pre-Lab using the node-voltage method. III. PRE-LABORATORY
Part 1: Mesh-current Analysis
Mesh-current analysis is a widely used method to solve AC electric circuits. This
method is particular useful when circuits contain more than one source. The AC mesh-current
method, like the DC mesh-current method, is based on Kirchhoff’s voltage law around each
closed loop. Once all the independent equations are obtained, they are solved simultaneously
for the loop currents. The rules for setting up and performing AC mesh-current analysis are the
same as those for DC mesh-current analysis. Remember, equations must be solved using
phasors and phasor algebra (i.e. all complex numbers).
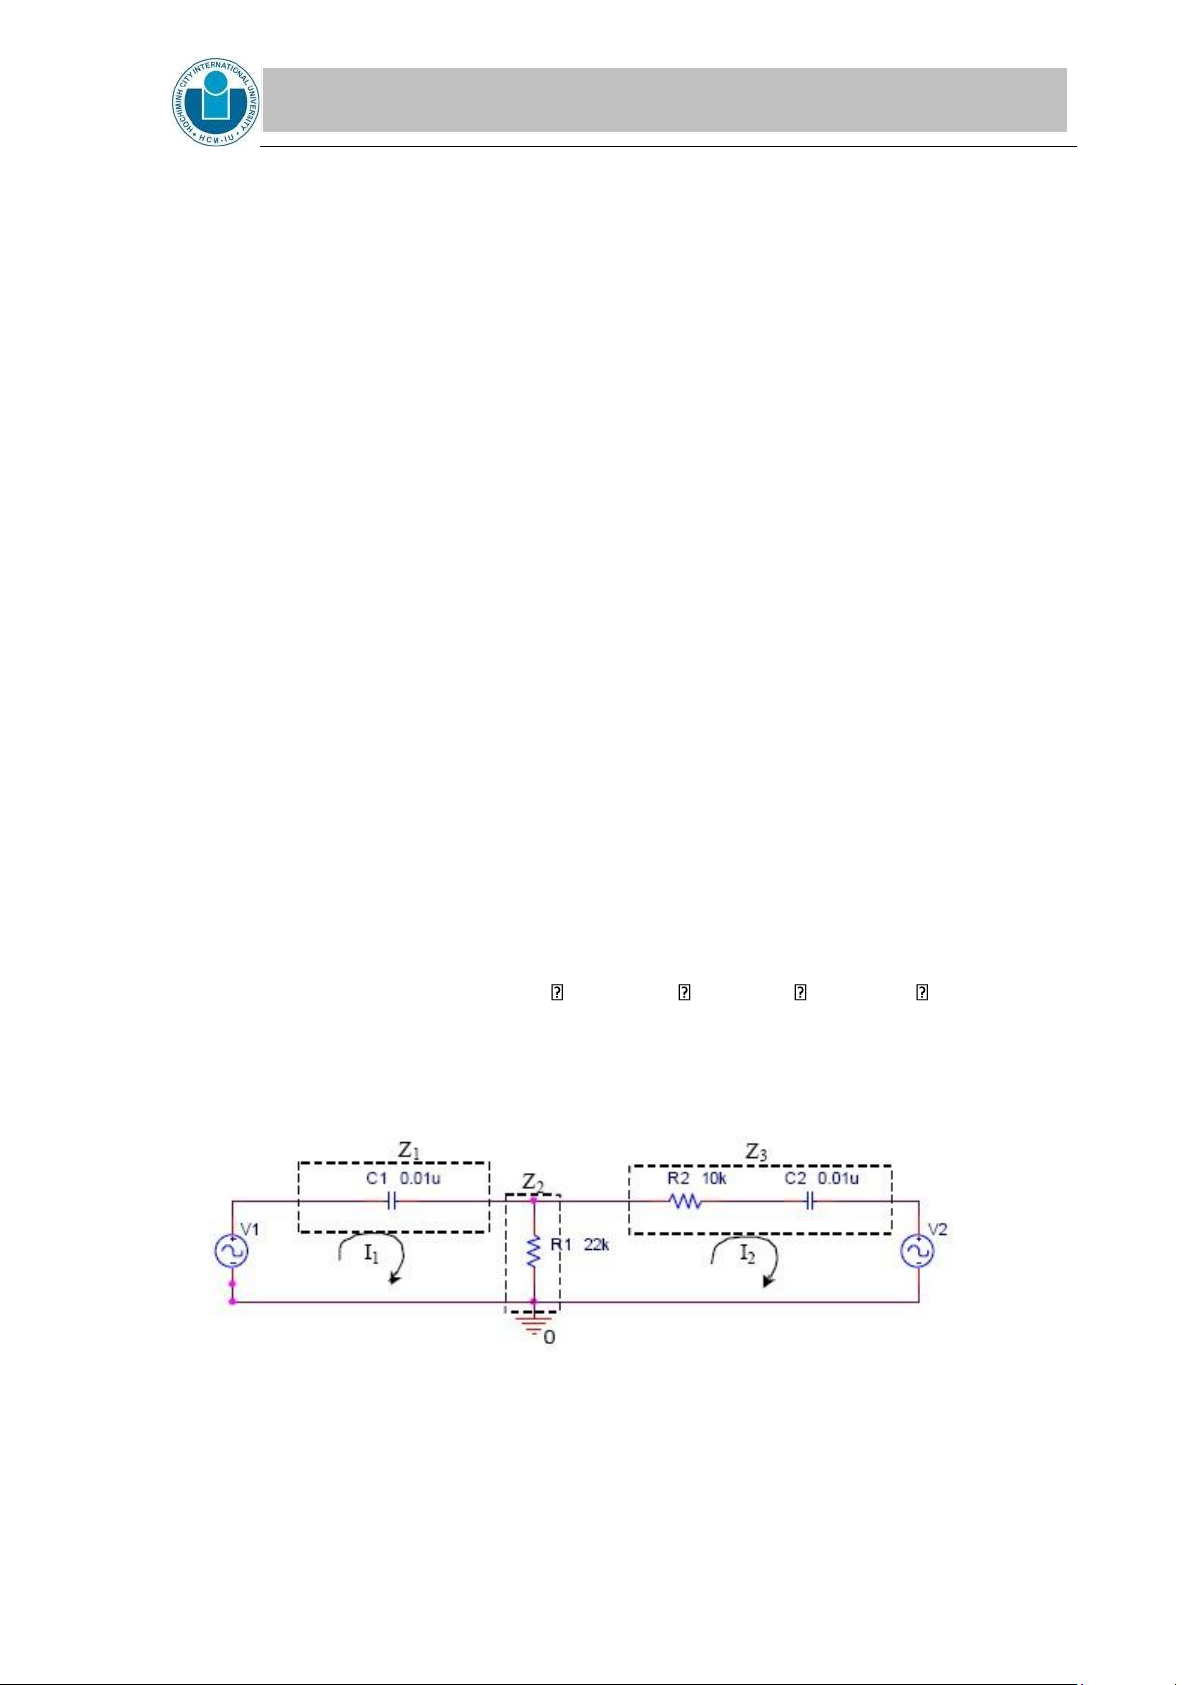
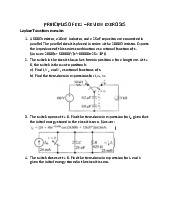
1. Using the mesh-current technique calculate the mesh current I1 and I2 of the circuit
shown in Figure 1. Assume C1 = 0.01 F, R1 = 22 k , R2 = 10 k , C2 = 0.01 F, f = 500
Hz, V1 = 5 V, and V2 = 3.37 V lagging 46˚ with respect to V1. Express the results in
phasor form (i.e. magnitude and angle). Show all your calculations. Using the calculated
mesh current, calculated the voltage drop in each impedance (VZ1, VZ2, and VZ3). Using
these results complete Table 1 on the Laboratory Data Section.
Figure 1. AC network used in the mesh-current analysis
2. Using Electronic Workbench, run a transient simulation (from 0 to 10 ms) of the circuit shown in Figure 1. lOMoAR cPSD| 58097008 INTERNATIONAL UNIVERSITY
SCHOOL OF ELECTRICAL ENGINEERING (EE)
a. Plot on the same graph the input voltages V1 and V2. Make sure that the
magnitudes of V1 and V2 are corrects (be careful with peak and peak-to-peak
values) and that V2 lags V1 by 46˚.
b. Plot on the same graph the input voltage V1 and the voltage across Z1. Using the
cursors of Probe, measure the magnitude and phase of the voltage drop cross Z1.
Use this value to complete Table 1.
c. Plot on the same graph the input voltage V1 and the voltage across Z2 and
measure the magnitude and phase of the voltage drop cross Z2. Use this value to complete Table 1.
d. Plot on the same graph the input voltage V1 and the voltage across Z3 and
measure the magnitude and phase of the voltage drop cross Z3. Use this value to complete Table 1.
e. Plot on the same graph but under different y-axis the input voltage V1 and the
mesh currents I1 and I2. Measure the magnitude and phase of each mesh current.
Complete Table 2 on the Laboratory Data Section.
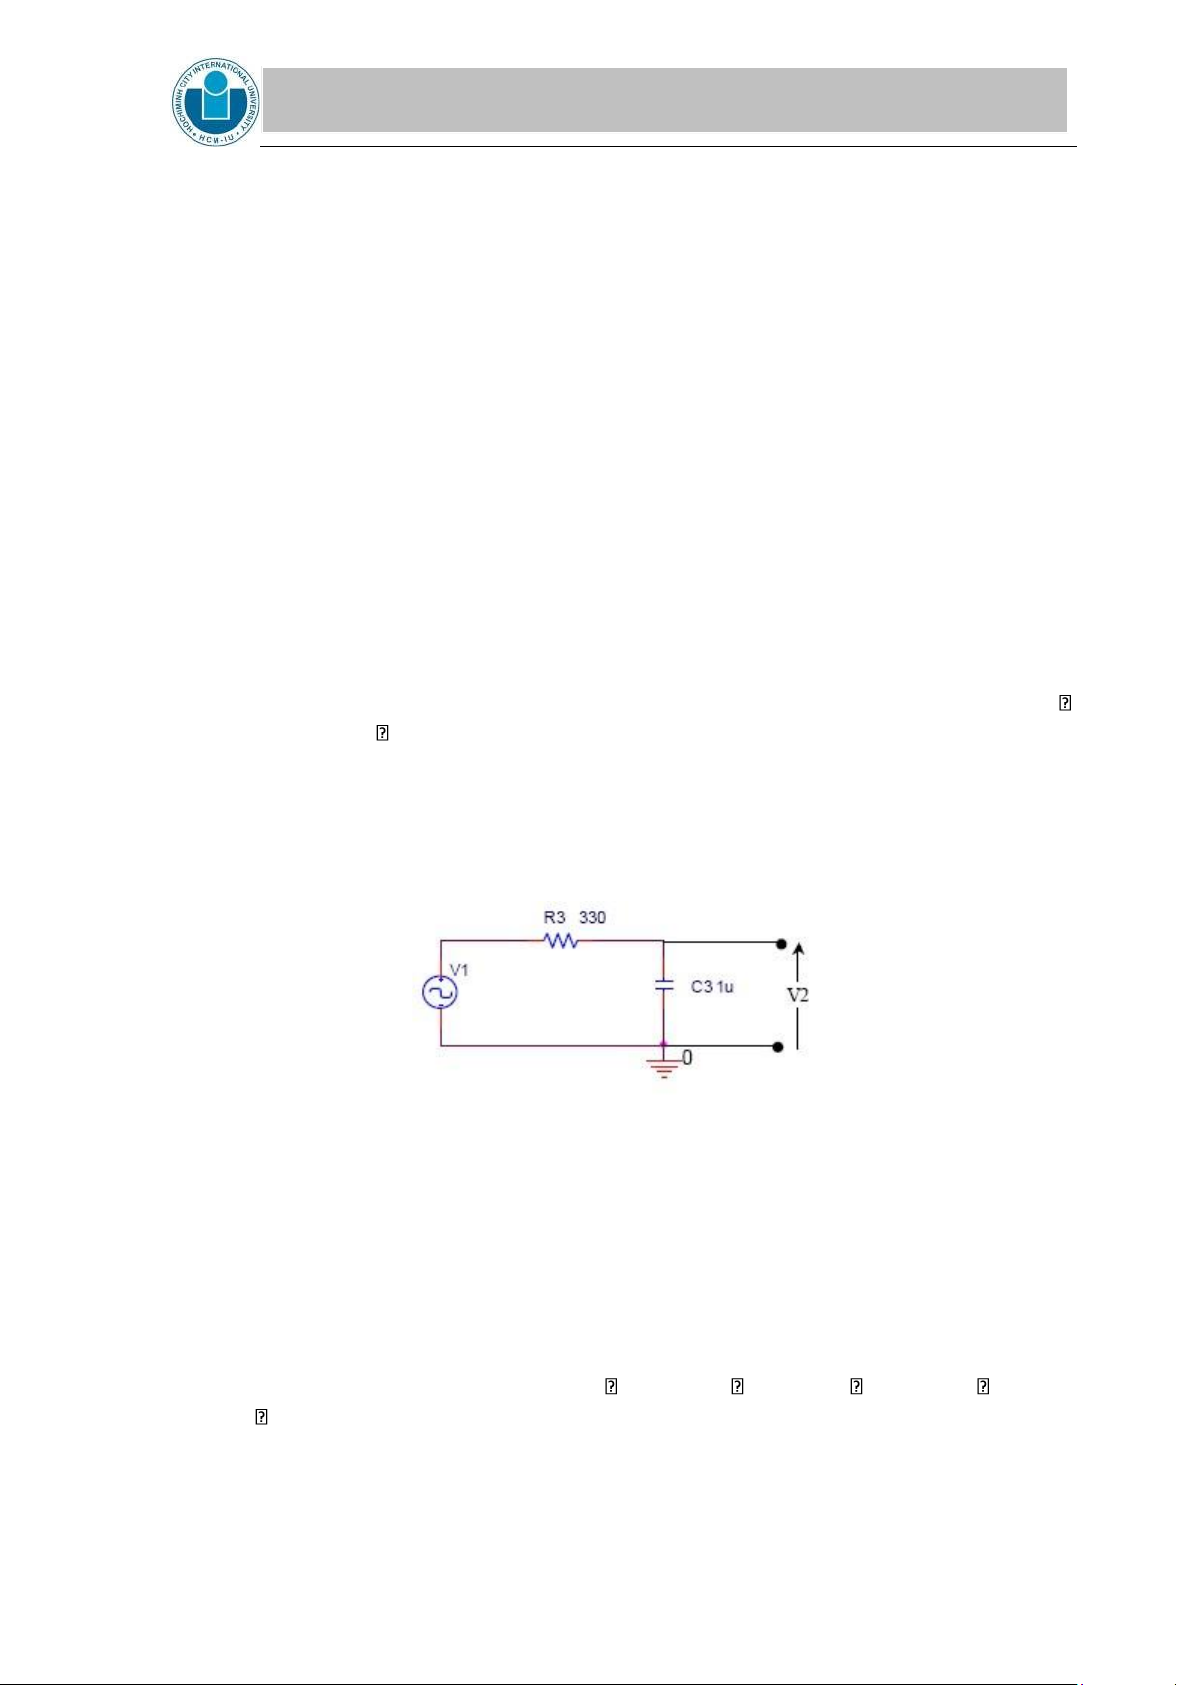
f. For the circuit presented in Figure 2, mathematically obtain the output voltage
V2. Express V2 in phasor form. Show all your calculations. Assume R3 = 330 ,
C3 = 1 F, f = 500 Hz, and V1 = 5 V rms.
g. Using PSpice, run a transient simulation (from 0 to 10 ms) for the circuit shown
in Figure 2. Plot on the same graph the input voltages V1 and output voltage V2.
What is the magnitude of V2? What is the phase difference between the input
voltage V1 and the output voltage V2? Express V2 in phasor form and compare
with the output voltage calculated in f.
Figure 2. Phase-shifting network
Part 2: Node-voltage Analysis
Like DC circuits, node-voltage or nodal analysis of AC circuit is based on Kirchhoff’s
current law. The procedure for setting up and solving an AC circuit by the node-voltage method
is the same as that for DC circuits. Remember, that equations must be solved using phasors and phasor algebra.
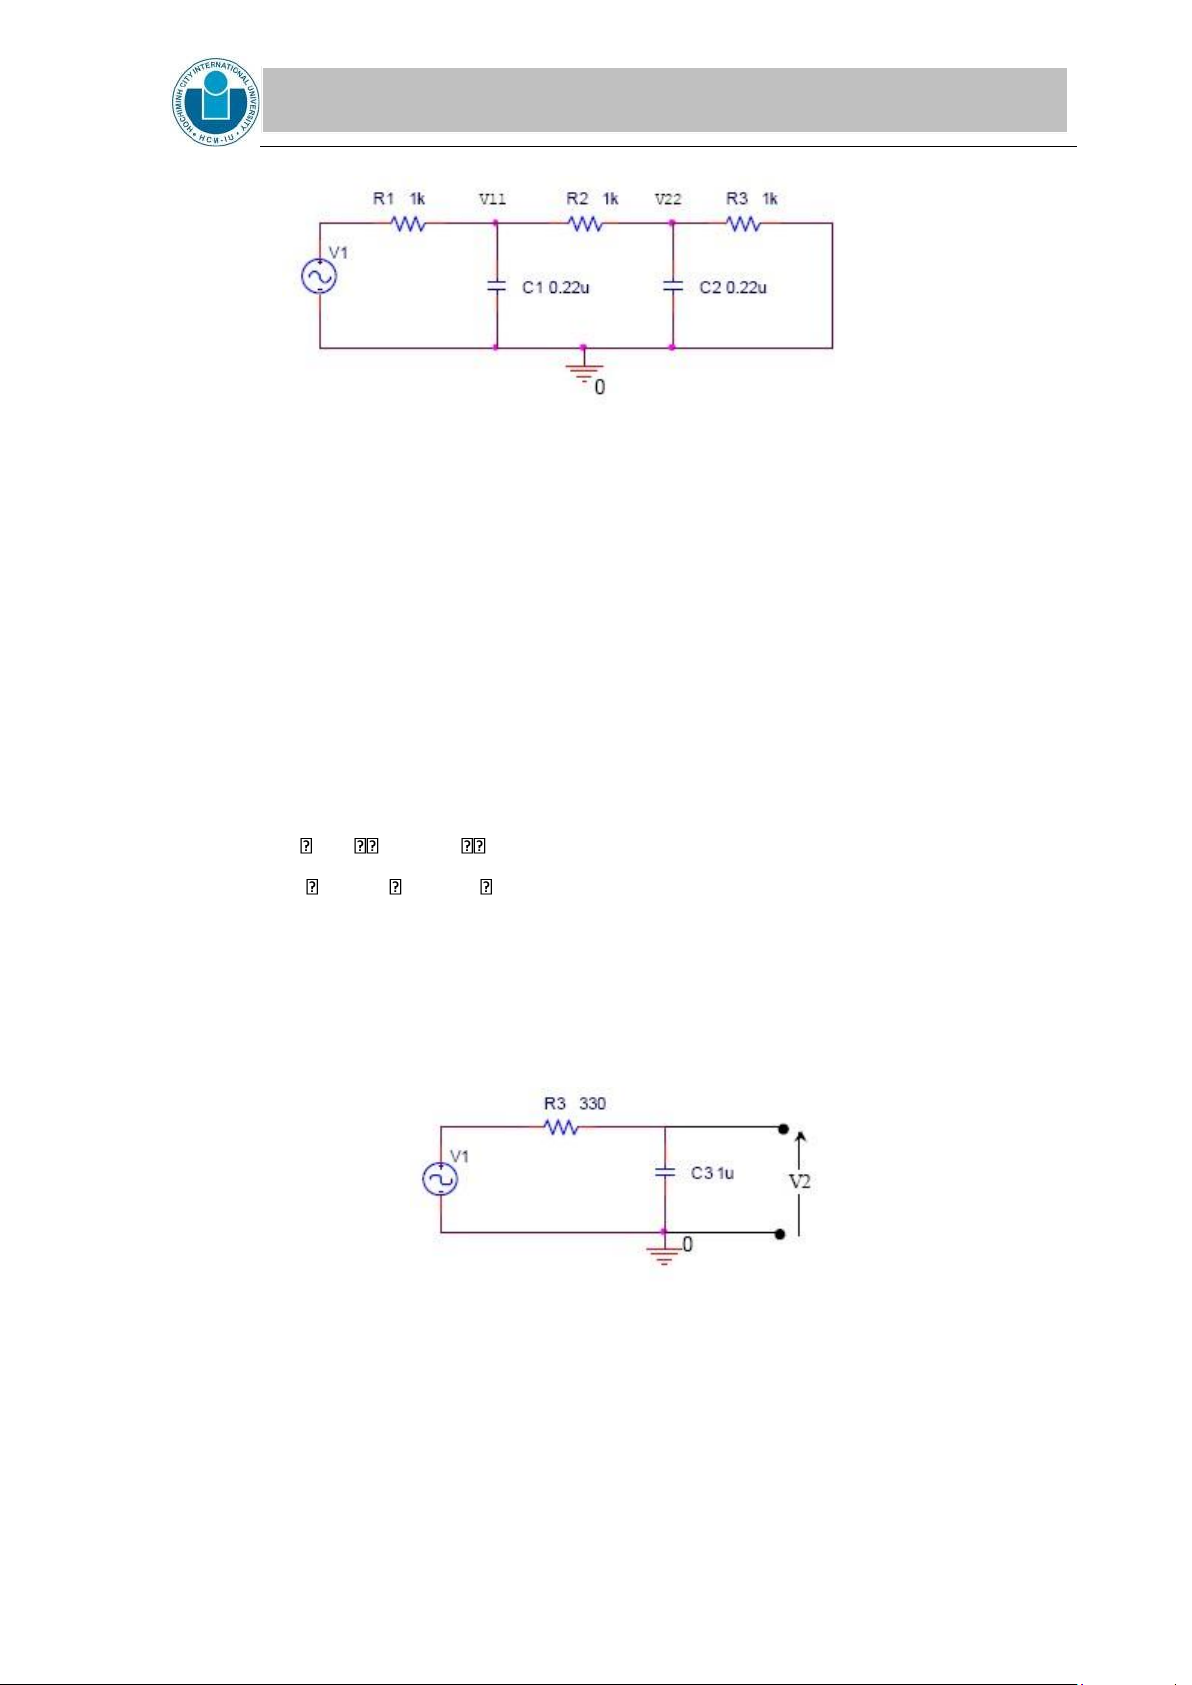
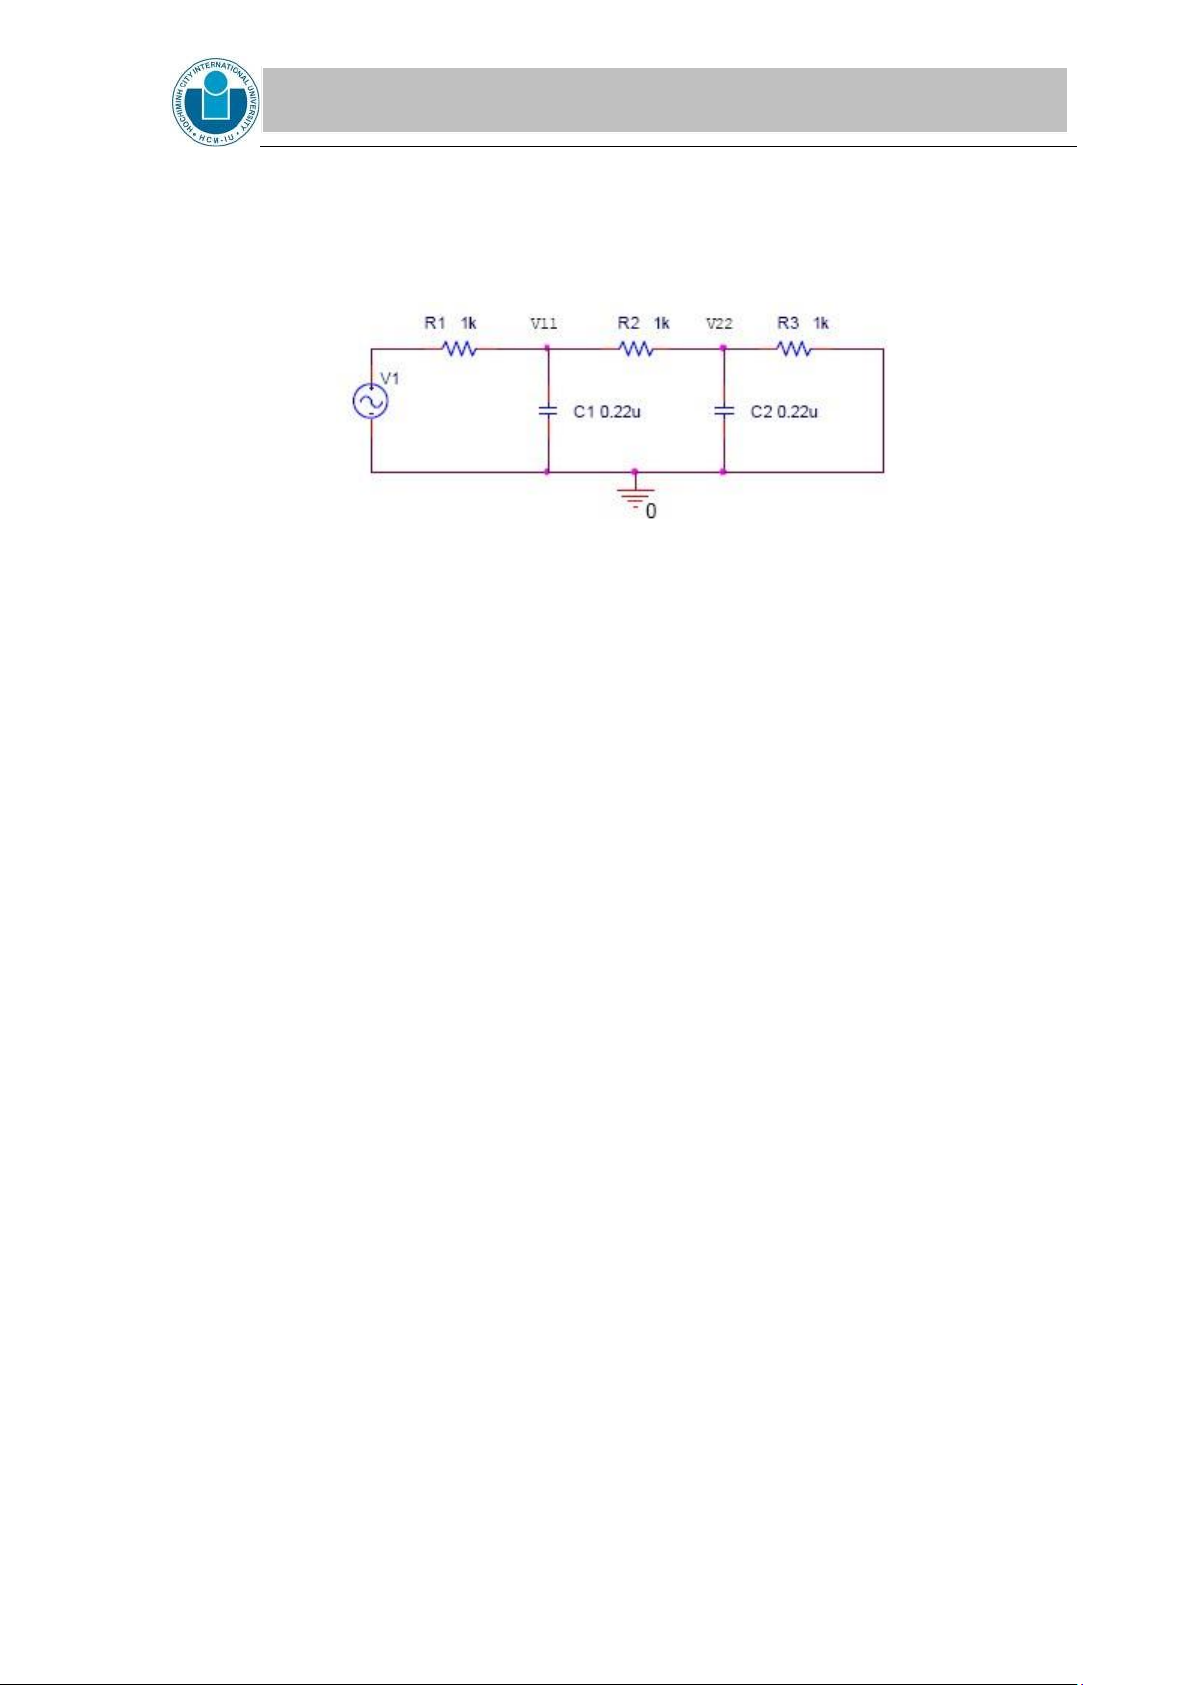
3. Using the node- voltage method calculate the node voltages V11 and V22 of the circuit
presented in Figure 3 where R1 = 1 k , C1 = 0.22 F, R2 = 1 k , C2 = 0.22 F, R3 = 1
k , f = 500 Hz, and V1 = 5 V. Express the results in phasor form. Show all your
calculations. Use these results to complete Table 3 on the Laboratory Data Section. lOMoAR cPSD| 58097008 INTERNATIONAL UNIVERSITY
SCHOOL OF ELECTRICAL ENGINEERING (EE)
Figure 3. AC circuit used in the node -voltage analysis
4. Run a transient simulation (from 0 to 10 ms) for the circuit shown in Figure 3.
a. Plot on the same graph the input voltage V1 and the node voltages V11 and V22.
Measure the magnitude and angle of the node voltages V11 and V22. Use these
results to complete Table 3 on the Laboratory data section.
b. Obtain the phasor form of the simulated node voltages V11 and V22. Compare
them with the phasor form of node voltages V11 and V22 calculated in 3 above. IV.
EQUIPMENT AND PARTS LIST • Dual-trace oscilloscope. • Waveform generator.
• 330 , 1k and 22k resistors.
• 0.01 F, 0.22 F and 1 F capacitors. • Breadboard. • Connecting wires. V. PROCEDURES
1. Construct the AC circuit shown in Figure 4 below.
Figure 4. Phase-shifting network
2. Stimulate the circuit with a sinusoidal waveform generator using a frequency of 500 Hz
and 5 V. Using the oscilloscope, connect Channel 1 across the input voltage source V1
and Channel 2 across the output V2. Measure V2 magnitude and phase.
3. When setting up a laboratory procedure to verify the mesh-current analysis, it is not
practical to use two different signal generators in the same circuit. Remember that lOMoAR cPSD| 58097008 INTERNATIONAL UNIVERSITY
SCHOOL OF ELECTRICAL ENGINEERING (EE)
phasor algebra is based on the assumption that all currents and voltages have identical
frequency. However, a signal generator tends to have frequency drift (i.e. the output
frequency of the generator changes with time); therefore, it is not possible for two
generator to produce exactly the same frequency over a long period of time. In order to
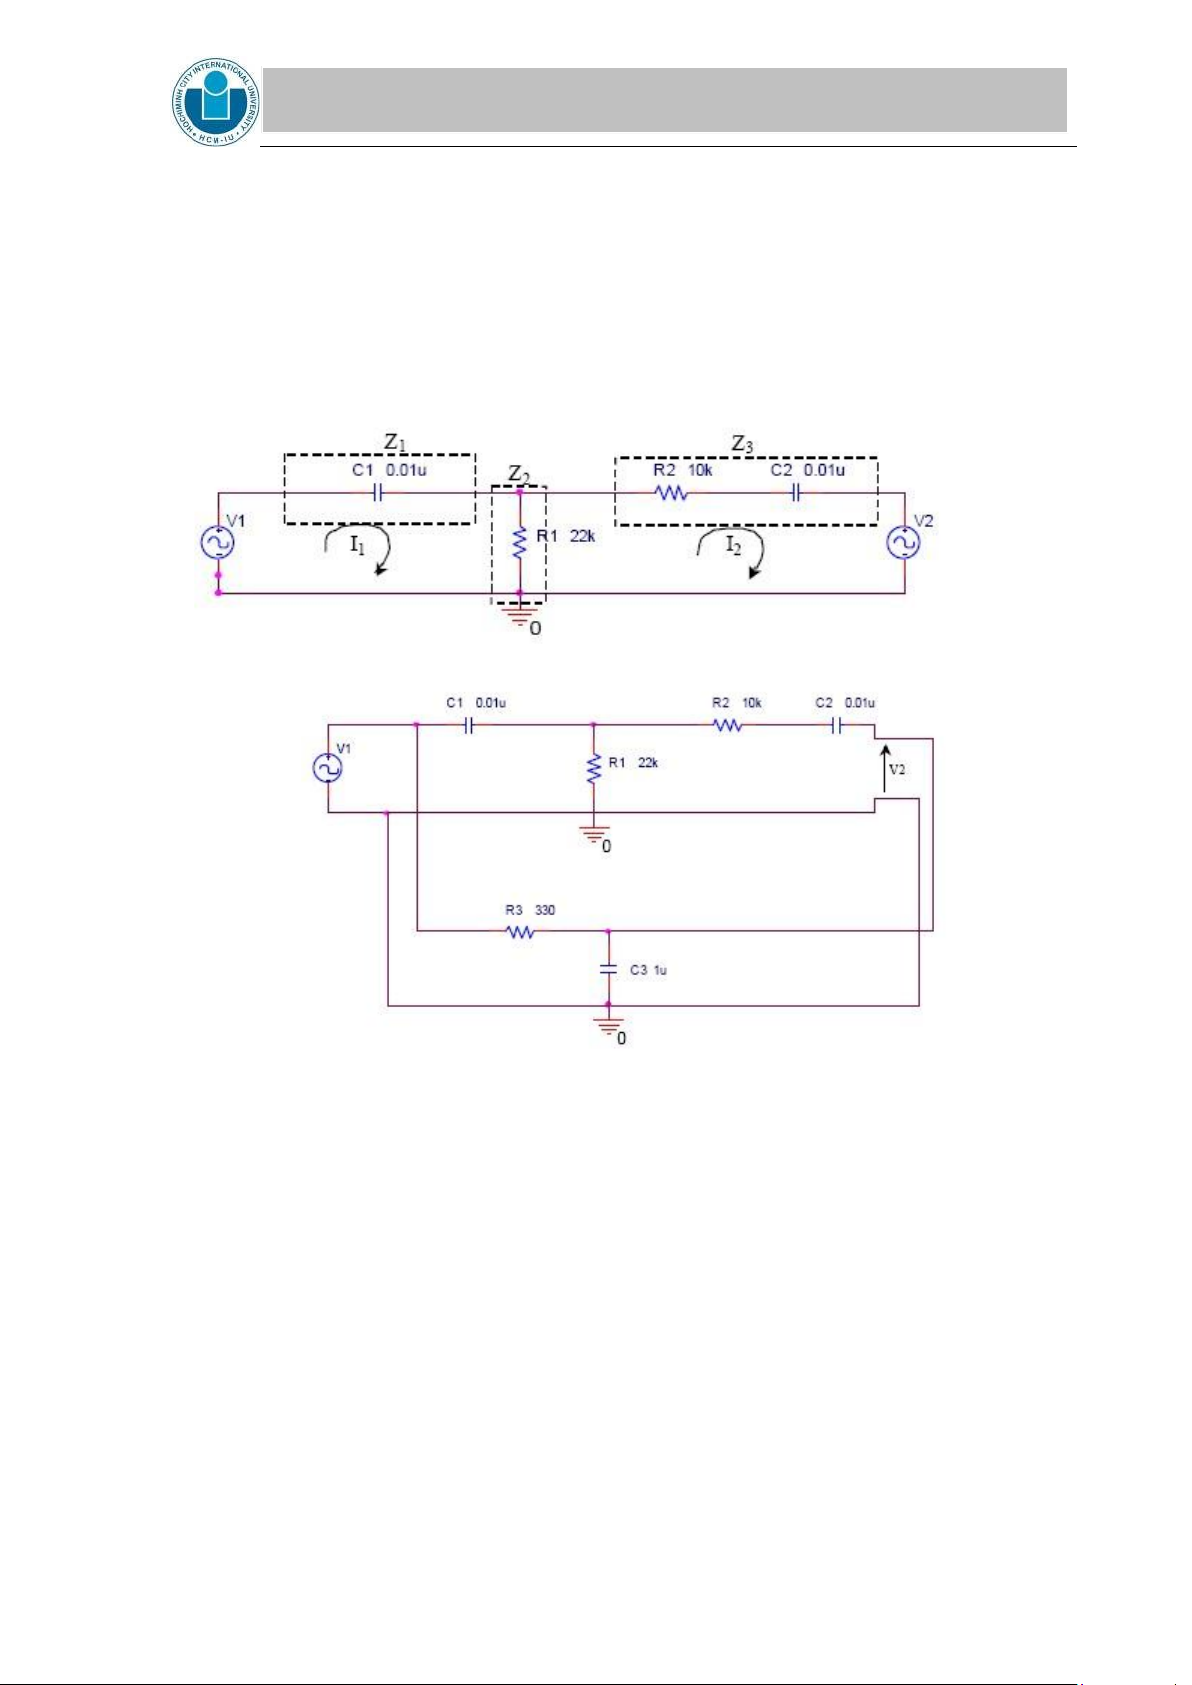
overcome this we ‘simulate’ a second source using a phase-shifting network delay. The
circuit shown in Figure 1 is practically implemented as shown in Figure 5. Construct
the AC circuit shown in Figure 5. Stimulate the circuit with a sinusoidal waveform
generator using a frequency of 500 Hz and 5 V. 4.
Figure 5. Practical implementation of the circuit shown in Figure 1
a. Measure the input voltages V1 and V2. Make sure that the magnitudes of V1 and V2
are corrects (i.e. be careful with peak and peak-to-peak values) and that V2 lags V1 by 46˚.
b. Use channel 1 to measure the input voltage V1. Use channel 2 and a differential
voltage probe, measure the voltage across Z1. Use these results to complete Table 1.
Remember to measure magnitude and phase.
c. Using channel 1, measure the input voltage V1. Using channel 2 and a differential
voltage probe, measure the voltage across Z2. Complete Table 1.
d. Use channel 1 to measure the input voltage V1. Use channel 2 and a differential
voltage probe, measure the voltage across Z3. Complete Table 1. lOMoAR cPSD| 58097008 INTERNATIONAL UNIVERSITY
SCHOOL OF ELECTRICAL ENGINEERING (EE)
e. Use channel 1 to measure the input voltage V1. Use channel 2, a differential voltage
probe and a “testing” resistor to measure the mesh currents I1 and I2.
Use these result to complete Table 2.
5. Construct the circuit shown in Figure 6 below.
Figure 6. AC circuit used in the node -voltage analysis
6. Stimulate the circuit with a sinusoidal waveform generator using a frequency of 500 Hz
and 5 V. Using the digital oscilloscope, connect Channel 1 across the input voltage source V1.
a. Use a second voltage probe on channel 2, in order to measure the node voltage
V11. Record the magnitude and the phase. Complete Table 3.
b. Measure the node voltage V22. Record the magnitude and the phase. Complete Table 3. VI. Post-Laboratory
1. Mesh-current Analysis:
a. Complete Table 1 with the obtained values. Use phasor form (i.e., magnitude and angle).
b. Compare the errors between calculated and simulated values, calculated and
measured values, and simulated and measured values. Draw a conclusion about
the accuracy of your simulation and measurements with respect to your calculation.
c. Complete Table 2 with the obtained values. Use phasor form (i.e., magnitude and angle).
d. Compare the errors between calculated and simulated values, calculated and
measured values, and simulated and measured values. Draw a conclusion about
the accuracy of your simulation and measurements.
2. Node-voltage Analysis:
a. Complete Table 3 with the obtained values. Use phasor form (i.e., magnitude and angle).
b. Compare the errors between calculated and simulated values, calculated and
measured values, and simulated and measured values. Draw a conclusion about
the accuracy of your simulation and measurements. lOMoAR cPSD| 58097008 INTERNATIONAL UNIVERSITY
SCHOOL OF ELECTRICAL ENGINEERING (EE)
Laboratory Data Section
Table 1: Mesh-Current Analysis Calculated Simulated Measured VZ1 [V] 2.64 VZ2 [V] 2.758 2.4 VZ3 [V]
Table 2: Mesh-Current Analysis Calculated Simulated Measured I1 [mA] I2 [mA]
Table 3: Node-Voltage Analysis Calculated Simulated Measured V11 [V] V22 [V]
Tài liệu liên quan:
-
Lab 4 - Exploring Operational Amplifiers and Their Configurations | Môn Principles of EE 1 - Trường Đại học Quốc tế, Đại học Quốc gia Thành phố Hồ Chí Minh
109 55 -
Lab 2: Kirchhoff's Current and Voltage Laws | Môn Principles of EE 1 - Trường Đại học Quốc tế, Đại học Quốc gia Thành phố Hồ Chí Minh
125 63 -
Lab 7: Operational Amplifiers Study Guide | Môn Principles of EE 1 - Trường Đại học Quốc tế, Đại học Quốc gia Thành phố Hồ Chí Minh
99 50 -
Review Exercises on Laplace Transform & Filter Concepts | Môn Principles of EE 1 - Trường Đại học Quốc tế, Đại học Quốc gia Thành phố Hồ Chí Minh
115 58